Immigrants from Lebanon vs Immigrants from Sierra Leone In Labor Force | Age 30-34
COMPARE
Immigrants from Lebanon
Immigrants from Sierra Leone
In Labor Force | Age 30-34
In Labor Force | Age 30-34 Comparison
Immigrants from Lebanon
Immigrants from Sierra Leone
83.9%
IN LABOR FORCE | AGE 30-34
0.4/ 100
METRIC RATING
256th/ 347
METRIC RANK
86.0%
IN LABOR FORCE | AGE 30-34
100.0/ 100
METRIC RATING
18th/ 347
METRIC RANK
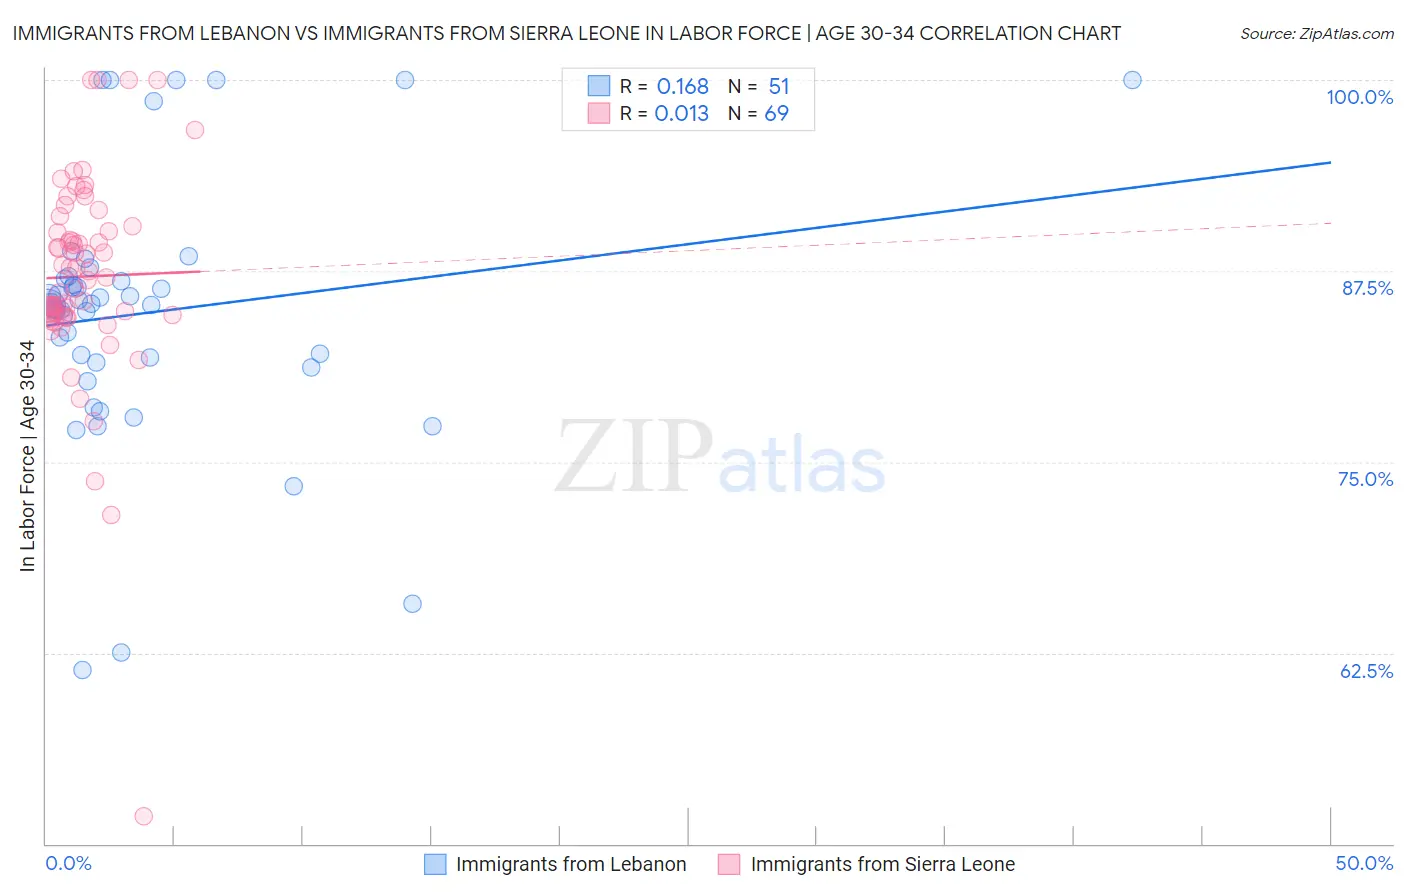
Immigrants from Lebanon vs Immigrants from Sierra Leone In Labor Force | Age 30-34 Correlation Chart
The statistical analysis conducted on geographies consisting of 217,118,980 people shows a poor positive correlation between the proportion of Immigrants from Lebanon and labor force participation rate among population between the ages 30 and 34 in the United States with a correlation coefficient (R) of 0.168 and weighted average of 83.9%. Similarly, the statistical analysis conducted on geographies consisting of 101,642,692 people shows no correlation between the proportion of Immigrants from Sierra Leone and labor force participation rate among population between the ages 30 and 34 in the United States with a correlation coefficient (R) of 0.013 and weighted average of 86.0%, a difference of 2.6%.
In Labor Force | Age 30-34 Correlation Summary
| Measurement | Immigrants from Lebanon | Immigrants from Sierra Leone |
| Minimum | 61.4% | 51.8% |
| Maximum | 100.0% | 100.0% |
| Range | 38.6% | 48.2% |
| Mean | 84.8% | 87.1% |
| Median | 85.3% | 87.1% |
| Interquartile 25% (IQ1) | 81.5% | 84.6% |
| Interquartile 75% (IQ3) | 87.0% | 90.2% |
| Interquartile Range (IQR) | 5.5% | 5.7% |
| Standard Deviation (Sample) | 8.5% | 6.9% |
| Standard Deviation (Population) | 8.4% | 6.9% |
Similar Demographics by In Labor Force | Age 30-34
Demographics Similar to Immigrants from Lebanon by In Labor Force | Age 30-34
In terms of in labor force | age 30-34, the demographic groups most similar to Immigrants from Lebanon are Iraqi (83.8%, a difference of 0.010%), White/Caucasian (83.9%, a difference of 0.040%), Honduran (83.8%, a difference of 0.040%), Scotch-Irish (83.8%, a difference of 0.050%), and Immigrants from St. Vincent and the Grenadines (83.9%, a difference of 0.060%).
| Demographics | Rating | Rank | In Labor Force | Age 30-34 |
| Immigrants | Dominica | 0.7 /100 | #249 | Tragic 84.0% |
| Immigrants | Iraq | 0.7 /100 | #250 | Tragic 83.9% |
| Nicaraguans | 0.6 /100 | #251 | Tragic 83.9% |
| Bahamians | 0.6 /100 | #252 | Tragic 83.9% |
| Immigrants | Nicaragua | 0.6 /100 | #253 | Tragic 83.9% |
| Immigrants | St. Vincent and the Grenadines | 0.5 /100 | #254 | Tragic 83.9% |
| Whites/Caucasians | 0.5 /100 | #255 | Tragic 83.9% |
| Immigrants | Lebanon | 0.4 /100 | #256 | Tragic 83.9% |
| Iraqis | 0.3 /100 | #257 | Tragic 83.8% |
| Hondurans | 0.3 /100 | #258 | Tragic 83.8% |
| Scotch-Irish | 0.3 /100 | #259 | Tragic 83.8% |
| Immigrants | Dominican Republic | 0.3 /100 | #260 | Tragic 83.8% |
| Guyanese | 0.3 /100 | #261 | Tragic 83.8% |
| Dominicans | 0.2 /100 | #262 | Tragic 83.8% |
| Immigrants | Guyana | 0.2 /100 | #263 | Tragic 83.8% |
Demographics Similar to Immigrants from Sierra Leone by In Labor Force | Age 30-34
In terms of in labor force | age 30-34, the demographic groups most similar to Immigrants from Sierra Leone are Latvian (86.0%, a difference of 0.040%), Immigrants from Cameroon (86.0%, a difference of 0.040%), Sierra Leonean (86.0%, a difference of 0.050%), Bulgarian (86.0%, a difference of 0.050%), and Immigrants from Bulgaria (86.0%, a difference of 0.060%).
| Demographics | Rating | Rank | In Labor Force | Age 30-34 |
| Carpatho Rusyns | 100.0 /100 | #11 | Exceptional 86.2% |
| Bolivians | 100.0 /100 | #12 | Exceptional 86.1% |
| Immigrants | Croatia | 100.0 /100 | #13 | Exceptional 86.1% |
| Immigrants | Cabo Verde | 100.0 /100 | #14 | Exceptional 86.1% |
| Immigrants | Albania | 100.0 /100 | #15 | Exceptional 86.1% |
| Latvians | 100.0 /100 | #16 | Exceptional 86.0% |
| Immigrants | Cameroon | 100.0 /100 | #17 | Exceptional 86.0% |
| Immigrants | Sierra Leone | 100.0 /100 | #18 | Exceptional 86.0% |
| Sierra Leoneans | 100.0 /100 | #19 | Exceptional 86.0% |
| Bulgarians | 100.0 /100 | #20 | Exceptional 86.0% |
| Immigrants | Bulgaria | 100.0 /100 | #21 | Exceptional 86.0% |
| Bermudans | 100.0 /100 | #22 | Exceptional 85.9% |
| Estonians | 100.0 /100 | #23 | Exceptional 85.9% |
| Immigrants | Eritrea | 100.0 /100 | #24 | Exceptional 85.9% |
| Immigrants | North Macedonia | 100.0 /100 | #25 | Exceptional 85.9% |