Immigrants from Lebanon vs Hispanic or Latino In Labor Force | Age 30-34
COMPARE
Immigrants from Lebanon
Hispanic or Latino
In Labor Force | Age 30-34
In Labor Force | Age 30-34 Comparison
Immigrants from Lebanon
Hispanics or Latinos
83.9%
IN LABOR FORCE | AGE 30-34
0.4/ 100
METRIC RATING
256th/ 347
METRIC RANK
82.4%
IN LABOR FORCE | AGE 30-34
0.0/ 100
METRIC RATING
301st/ 347
METRIC RANK
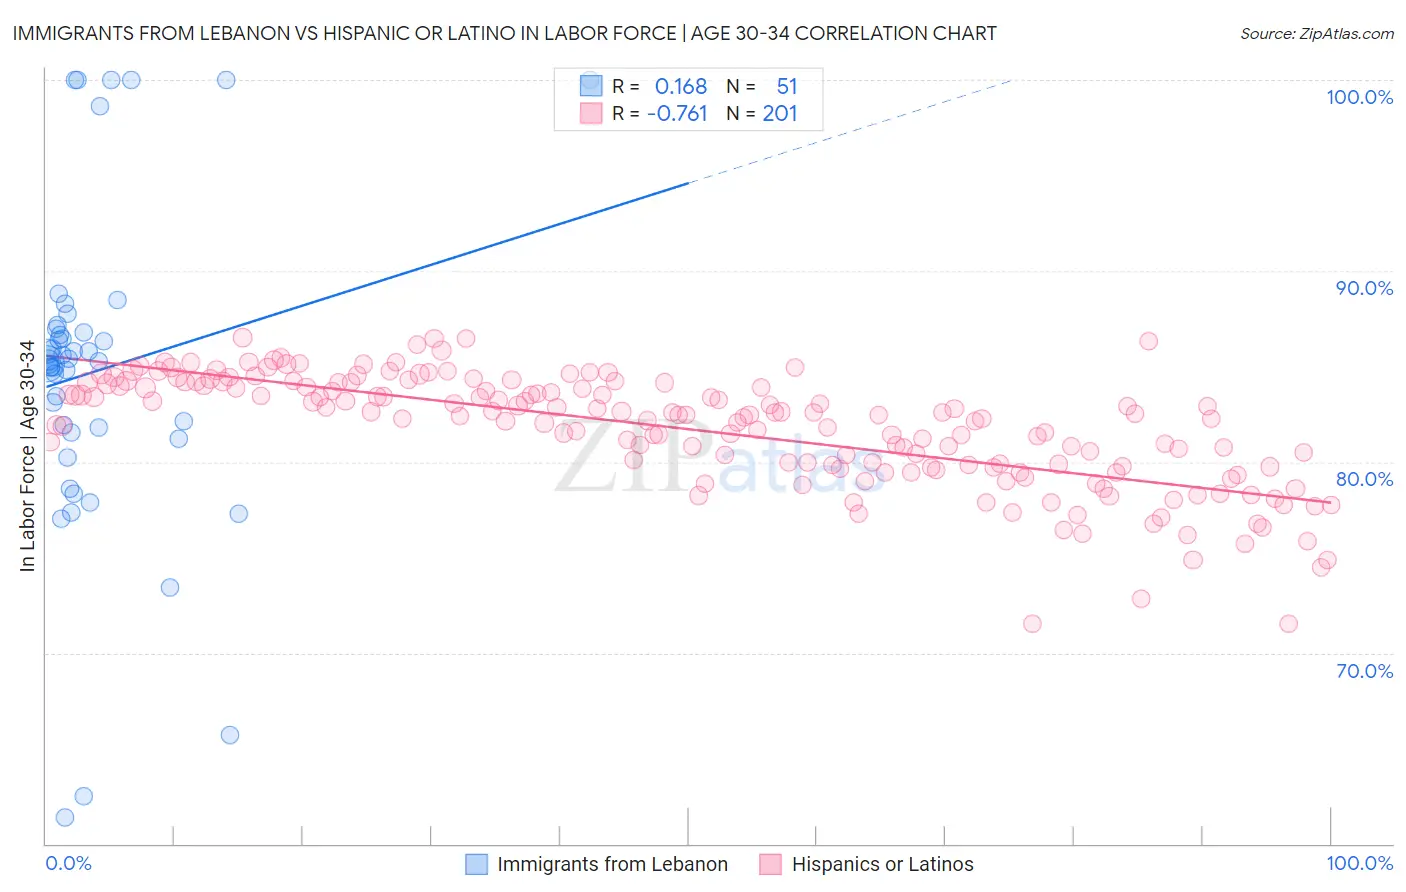
Immigrants from Lebanon vs Hispanic or Latino In Labor Force | Age 30-34 Correlation Chart
The statistical analysis conducted on geographies consisting of 217,118,980 people shows a poor positive correlation between the proportion of Immigrants from Lebanon and labor force participation rate among population between the ages 30 and 34 in the United States with a correlation coefficient (R) of 0.168 and weighted average of 83.9%. Similarly, the statistical analysis conducted on geographies consisting of 576,977,639 people shows a strong negative correlation between the proportion of Hispanics or Latinos and labor force participation rate among population between the ages 30 and 34 in the United States with a correlation coefficient (R) of -0.761 and weighted average of 82.4%, a difference of 1.7%.
In Labor Force | Age 30-34 Correlation Summary
| Measurement | Immigrants from Lebanon | Hispanic or Latino |
| Minimum | 61.4% | 71.5% |
| Maximum | 100.0% | 86.5% |
| Range | 38.6% | 15.0% |
| Mean | 84.8% | 81.7% |
| Median | 85.3% | 82.4% |
| Interquartile 25% (IQ1) | 81.5% | 79.8% |
| Interquartile 75% (IQ3) | 87.0% | 84.0% |
| Interquartile Range (IQR) | 5.5% | 4.3% |
| Standard Deviation (Sample) | 8.5% | 2.9% |
| Standard Deviation (Population) | 8.4% | 2.9% |
Similar Demographics by In Labor Force | Age 30-34
Demographics Similar to Immigrants from Lebanon by In Labor Force | Age 30-34
In terms of in labor force | age 30-34, the demographic groups most similar to Immigrants from Lebanon are Iraqi (83.8%, a difference of 0.010%), White/Caucasian (83.9%, a difference of 0.040%), Honduran (83.8%, a difference of 0.040%), Scotch-Irish (83.8%, a difference of 0.050%), and Immigrants from St. Vincent and the Grenadines (83.9%, a difference of 0.060%).
| Demographics | Rating | Rank | In Labor Force | Age 30-34 |
| Immigrants | Dominica | 0.7 /100 | #249 | Tragic 84.0% |
| Immigrants | Iraq | 0.7 /100 | #250 | Tragic 83.9% |
| Nicaraguans | 0.6 /100 | #251 | Tragic 83.9% |
| Bahamians | 0.6 /100 | #252 | Tragic 83.9% |
| Immigrants | Nicaragua | 0.6 /100 | #253 | Tragic 83.9% |
| Immigrants | St. Vincent and the Grenadines | 0.5 /100 | #254 | Tragic 83.9% |
| Whites/Caucasians | 0.5 /100 | #255 | Tragic 83.9% |
| Immigrants | Lebanon | 0.4 /100 | #256 | Tragic 83.9% |
| Iraqis | 0.3 /100 | #257 | Tragic 83.8% |
| Hondurans | 0.3 /100 | #258 | Tragic 83.8% |
| Scotch-Irish | 0.3 /100 | #259 | Tragic 83.8% |
| Immigrants | Dominican Republic | 0.3 /100 | #260 | Tragic 83.8% |
| Guyanese | 0.3 /100 | #261 | Tragic 83.8% |
| Dominicans | 0.2 /100 | #262 | Tragic 83.8% |
| Immigrants | Guyana | 0.2 /100 | #263 | Tragic 83.8% |
Demographics Similar to Hispanics or Latinos by In Labor Force | Age 30-34
In terms of in labor force | age 30-34, the demographic groups most similar to Hispanics or Latinos are Hmong (82.4%, a difference of 0.010%), Ottawa (82.4%, a difference of 0.030%), Immigrants from Micronesia (82.4%, a difference of 0.040%), Immigrants from Central America (82.5%, a difference of 0.070%), and Tlingit-Haida (82.3%, a difference of 0.12%).
| Demographics | Rating | Rank | In Labor Force | Age 30-34 |
| Americans | 0.0 /100 | #294 | Tragic 82.7% |
| Pennsylvania Germans | 0.0 /100 | #295 | Tragic 82.6% |
| Chippewa | 0.0 /100 | #296 | Tragic 82.6% |
| Comanche | 0.0 /100 | #297 | Tragic 82.6% |
| Aleuts | 0.0 /100 | #298 | Tragic 82.6% |
| Immigrants | Central America | 0.0 /100 | #299 | Tragic 82.5% |
| Hmong | 0.0 /100 | #300 | Tragic 82.4% |
| Hispanics or Latinos | 0.0 /100 | #301 | Tragic 82.4% |
| Ottawa | 0.0 /100 | #302 | Tragic 82.4% |
| Immigrants | Micronesia | 0.0 /100 | #303 | Tragic 82.4% |
| Tlingit-Haida | 0.0 /100 | #304 | Tragic 82.3% |
| Osage | 0.0 /100 | #305 | Tragic 82.3% |
| Spanish American Indians | 0.0 /100 | #306 | Tragic 82.2% |
| Menominee | 0.0 /100 | #307 | Tragic 82.2% |
| Puget Sound Salish | 0.0 /100 | #308 | Tragic 82.1% |