Immigrants from Lebanon vs Immigrants from Oceania In Labor Force | Age 30-34
COMPARE
Immigrants from Lebanon
Immigrants from Oceania
In Labor Force | Age 30-34
In Labor Force | Age 30-34 Comparison
Immigrants from Lebanon
Immigrants from Oceania
83.9%
IN LABOR FORCE | AGE 30-34
0.4/ 100
METRIC RATING
256th/ 347
METRIC RANK
84.0%
IN LABOR FORCE | AGE 30-34
1.1/ 100
METRIC RATING
242nd/ 347
METRIC RANK
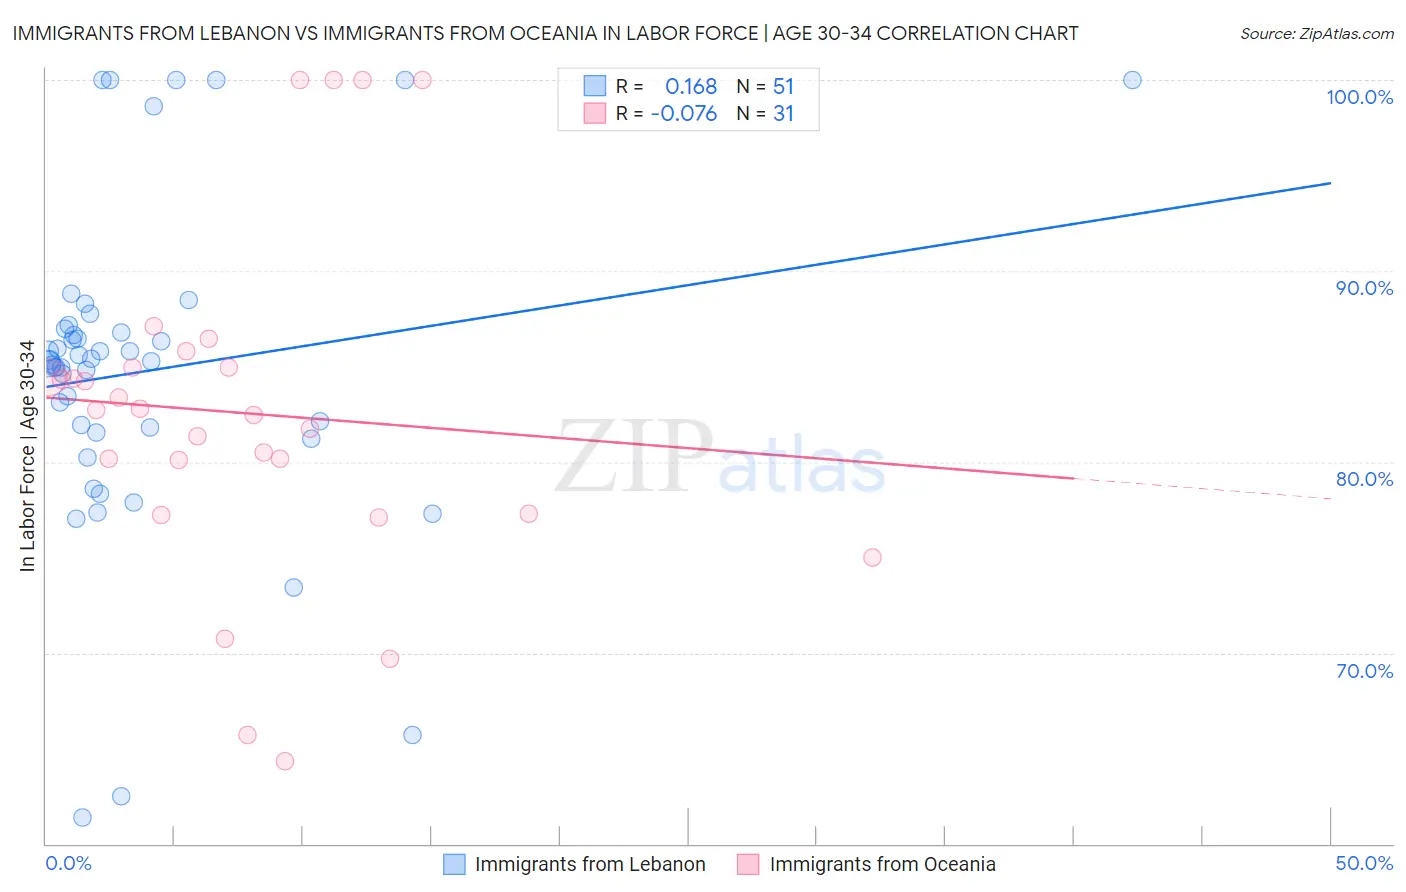
Immigrants from Lebanon vs Immigrants from Oceania In Labor Force | Age 30-34 Correlation Chart
The statistical analysis conducted on geographies consisting of 217,118,980 people shows a poor positive correlation between the proportion of Immigrants from Lebanon and labor force participation rate among population between the ages 30 and 34 in the United States with a correlation coefficient (R) of 0.168 and weighted average of 83.9%. Similarly, the statistical analysis conducted on geographies consisting of 305,403,957 people shows a slight negative correlation between the proportion of Immigrants from Oceania and labor force participation rate among population between the ages 30 and 34 in the United States with a correlation coefficient (R) of -0.076 and weighted average of 84.0%, a difference of 0.20%.
In Labor Force | Age 30-34 Correlation Summary
| Measurement | Immigrants from Lebanon | Immigrants from Oceania |
| Minimum | 61.4% | 64.3% |
| Maximum | 100.0% | 100.0% |
| Range | 38.6% | 35.7% |
| Mean | 84.8% | 82.5% |
| Median | 85.3% | 82.7% |
| Interquartile 25% (IQ1) | 81.5% | 77.3% |
| Interquartile 75% (IQ3) | 87.0% | 84.9% |
| Interquartile Range (IQR) | 5.5% | 7.6% |
| Standard Deviation (Sample) | 8.5% | 8.9% |
| Standard Deviation (Population) | 8.4% | 8.8% |
Demographics Similar to Immigrants from Lebanon and Immigrants from Oceania by In Labor Force | Age 30-34
In terms of in labor force | age 30-34, the demographic groups most similar to Immigrants from Lebanon are Iraqi (83.8%, a difference of 0.010%), White/Caucasian (83.9%, a difference of 0.040%), Honduran (83.8%, a difference of 0.040%), Scotch-Irish (83.8%, a difference of 0.050%), and Immigrants from St. Vincent and the Grenadines (83.9%, a difference of 0.060%). Similarly, the demographic groups most similar to Immigrants from Oceania are Immigrants from Portugal (84.0%, a difference of 0.010%), Immigrants from Caribbean (84.0%, a difference of 0.010%), English (84.0%, a difference of 0.030%), Venezuelan (84.0%, a difference of 0.030%), and Basque (84.0%, a difference of 0.040%).
| Demographics | Rating | Rank | In Labor Force | Age 30-34 |
| English | 1.4 /100 | #239 | Tragic 84.0% |
| Venezuelans | 1.3 /100 | #240 | Tragic 84.0% |
| Immigrants | Portugal | 1.2 /100 | #241 | Tragic 84.0% |
| Immigrants | Oceania | 1.1 /100 | #242 | Tragic 84.0% |
| Immigrants | Caribbean | 1.1 /100 | #243 | Tragic 84.0% |
| Basques | 0.9 /100 | #244 | Tragic 84.0% |
| Immigrants | Venezuela | 0.9 /100 | #245 | Tragic 84.0% |
| Central Americans | 0.9 /100 | #246 | Tragic 84.0% |
| British West Indians | 0.8 /100 | #247 | Tragic 84.0% |
| Portuguese | 0.8 /100 | #248 | Tragic 84.0% |
| Immigrants | Dominica | 0.7 /100 | #249 | Tragic 84.0% |
| Immigrants | Iraq | 0.7 /100 | #250 | Tragic 83.9% |
| Nicaraguans | 0.6 /100 | #251 | Tragic 83.9% |
| Bahamians | 0.6 /100 | #252 | Tragic 83.9% |
| Immigrants | Nicaragua | 0.6 /100 | #253 | Tragic 83.9% |
| Immigrants | St. Vincent and the Grenadines | 0.5 /100 | #254 | Tragic 83.9% |
| Whites/Caucasians | 0.5 /100 | #255 | Tragic 83.9% |
| Immigrants | Lebanon | 0.4 /100 | #256 | Tragic 83.9% |
| Iraqis | 0.3 /100 | #257 | Tragic 83.8% |
| Hondurans | 0.3 /100 | #258 | Tragic 83.8% |
| Scotch-Irish | 0.3 /100 | #259 | Tragic 83.8% |