Immigrants from Latvia vs Immigrants from Burma/Myanmar Unemployment Among Seniors over 75 years
COMPARE
Immigrants from Latvia
Immigrants from Burma/Myanmar
Unemployment Among Seniors over 75 years
Unemployment Among Seniors over 75 years Comparison
Immigrants from Latvia
Immigrants from Burma/Myanmar
7.8%
UNEMPLOYMENT AMONG SENIORS OVER 75 YEARS
100.0/ 100
METRIC RATING
50th/ 347
METRIC RANK
7.7%
UNEMPLOYMENT AMONG SENIORS OVER 75 YEARS
100.0/ 100
METRIC RATING
41st/ 347
METRIC RANK
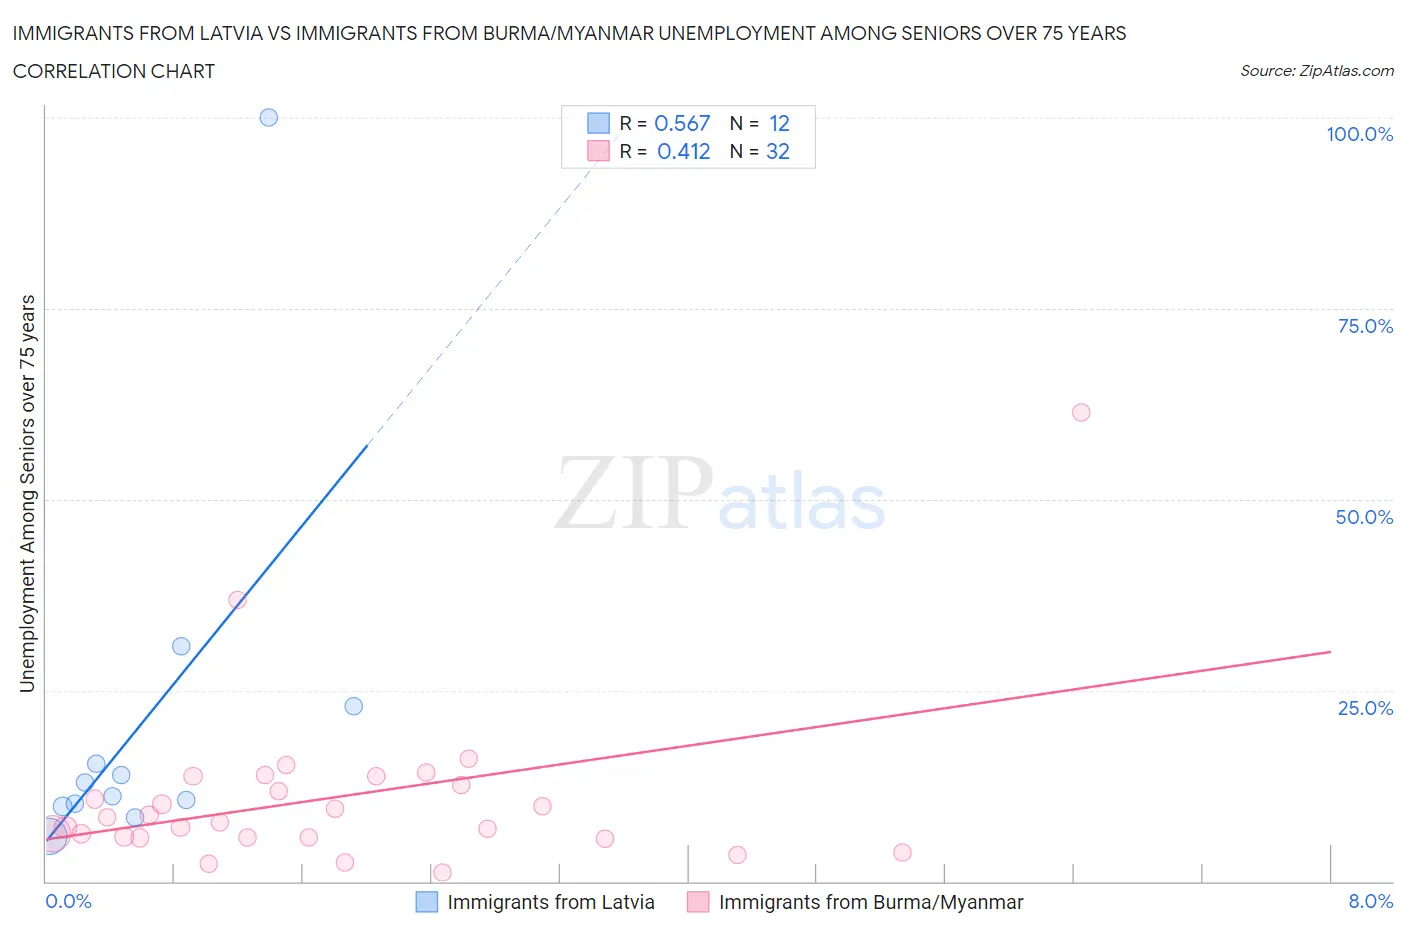
Immigrants from Latvia vs Immigrants from Burma/Myanmar Unemployment Among Seniors over 75 years Correlation Chart
The statistical analysis conducted on geographies consisting of 84,059,408 people shows a substantial positive correlation between the proportion of Immigrants from Latvia and unemployment rate among seniors over the age of 75 in the United States with a correlation coefficient (R) of 0.567 and weighted average of 7.8%. Similarly, the statistical analysis conducted on geographies consisting of 114,707,279 people shows a moderate positive correlation between the proportion of Immigrants from Burma/Myanmar and unemployment rate among seniors over the age of 75 in the United States with a correlation coefficient (R) of 0.412 and weighted average of 7.7%, a difference of 1.3%.
Unemployment Among Seniors over 75 years Correlation Summary
| Measurement | Immigrants from Latvia | Immigrants from Burma/Myanmar |
| Minimum | 5.8% | 1.1% |
| Maximum | 100.0% | 61.4% |
| Range | 94.2% | 60.3% |
| Mean | 21.0% | 10.9% |
| Median | 12.0% | 8.1% |
| Interquartile 25% (IQ1) | 10.0% | 5.7% |
| Interquartile 75% (IQ3) | 19.1% | 13.2% |
| Interquartile Range (IQR) | 9.1% | 7.5% |
| Standard Deviation (Sample) | 25.8% | 11.2% |
| Standard Deviation (Population) | 24.7% | 11.0% |
Demographics Similar to Immigrants from Latvia and Immigrants from Burma/Myanmar by Unemployment Among Seniors over 75 years
In terms of unemployment among seniors over 75 years, the demographic groups most similar to Immigrants from Latvia are Potawatomi (7.8%, a difference of 0.020%), Immigrants from Chile (7.8%, a difference of 0.050%), Moroccan (7.8%, a difference of 0.050%), Creek (7.8%, a difference of 0.28%), and Bahamian (7.8%, a difference of 0.30%). Similarly, the demographic groups most similar to Immigrants from Burma/Myanmar are Colville (7.7%, a difference of 0.13%), Ugandan (7.7%, a difference of 0.16%), Kiowa (7.7%, a difference of 0.20%), Immigrants from Hungary (7.7%, a difference of 0.21%), and Pueblo (7.7%, a difference of 0.23%).
| Demographics | Rating | Rank | Unemployment Among Seniors over 75 years |
| Immigrants | Norway | 100.0 /100 | #35 | Exceptional 7.7% |
| Luxembourgers | 100.0 /100 | #36 | Exceptional 7.7% |
| Immigrants | Hungary | 100.0 /100 | #37 | Exceptional 7.7% |
| Kiowa | 100.0 /100 | #38 | Exceptional 7.7% |
| Ugandans | 100.0 /100 | #39 | Exceptional 7.7% |
| Colville | 100.0 /100 | #40 | Exceptional 7.7% |
| Immigrants | Burma/Myanmar | 100.0 /100 | #41 | Exceptional 7.7% |
| Pueblo | 100.0 /100 | #42 | Exceptional 7.7% |
| Immigrants | Denmark | 100.0 /100 | #43 | Exceptional 7.8% |
| Immigrants | Spain | 100.0 /100 | #44 | Exceptional 7.8% |
| British West Indians | 100.0 /100 | #45 | Exceptional 7.8% |
| Immigrants | China | 100.0 /100 | #46 | Exceptional 7.8% |
| Creek | 100.0 /100 | #47 | Exceptional 7.8% |
| Immigrants | Chile | 100.0 /100 | #48 | Exceptional 7.8% |
| Potawatomi | 100.0 /100 | #49 | Exceptional 7.8% |
| Immigrants | Latvia | 100.0 /100 | #50 | Exceptional 7.8% |
| Moroccans | 100.0 /100 | #51 | Exceptional 7.8% |
| Bahamians | 100.0 /100 | #52 | Exceptional 7.8% |
| Immigrants | Egypt | 100.0 /100 | #53 | Exceptional 7.9% |
| Immigrants | Malaysia | 99.9 /100 | #54 | Exceptional 7.9% |
| Filipinos | 99.9 /100 | #55 | Exceptional 7.9% |