Immigrants from Latvia vs Cherokee In Labor Force | Age 30-34
COMPARE
Immigrants from Latvia
Cherokee
In Labor Force | Age 30-34
In Labor Force | Age 30-34 Comparison
Immigrants from Latvia
Cherokee
85.9%
IN LABOR FORCE | AGE 30-34
100.0/ 100
METRIC RATING
28th/ 347
METRIC RANK
81.6%
IN LABOR FORCE | AGE 30-34
0.0/ 100
METRIC RATING
315th/ 347
METRIC RANK
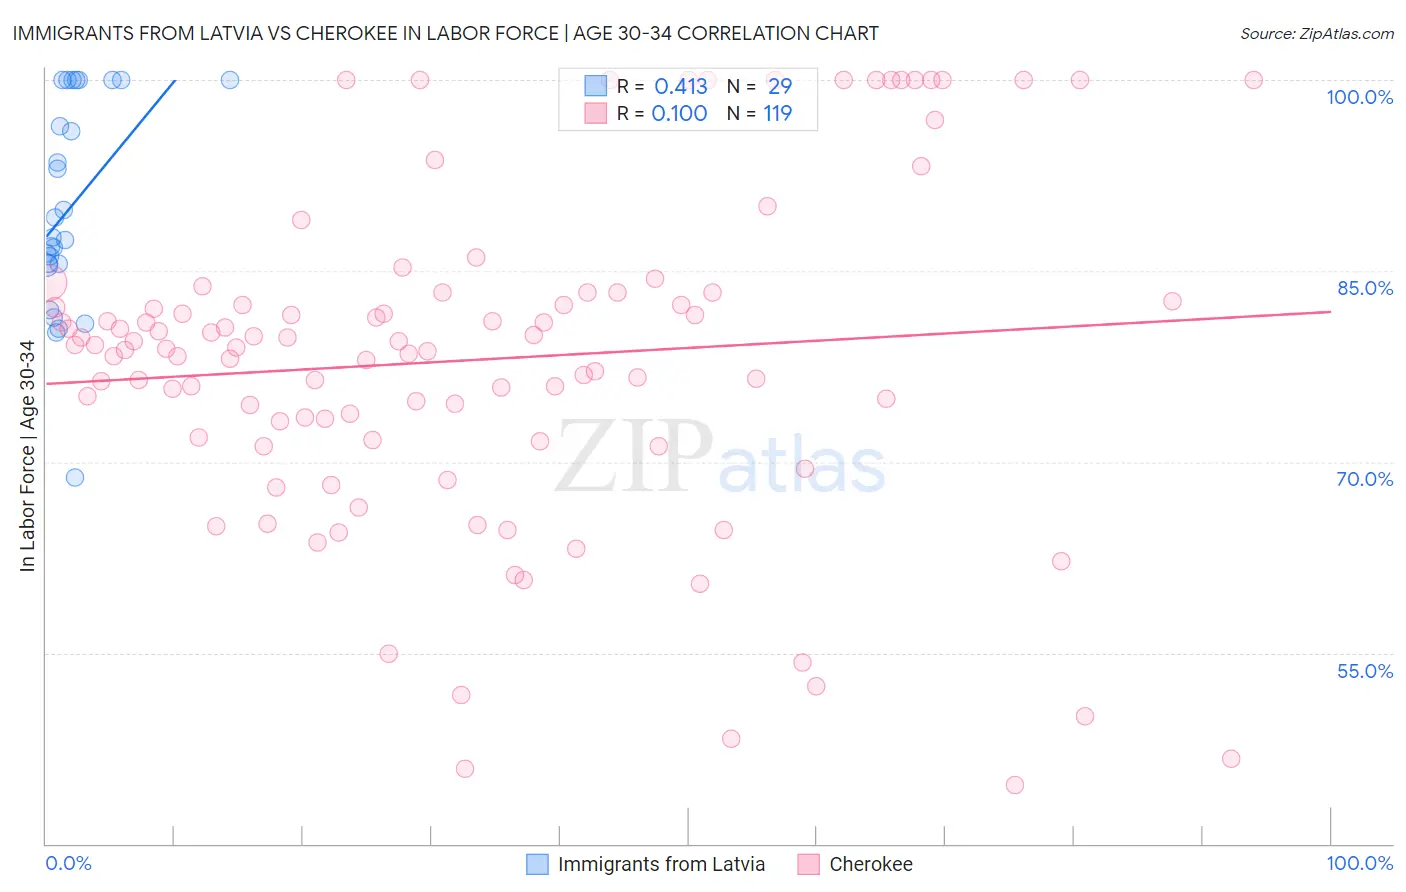
Immigrants from Latvia vs Cherokee In Labor Force | Age 30-34 Correlation Chart
The statistical analysis conducted on geographies consisting of 113,732,113 people shows a moderate positive correlation between the proportion of Immigrants from Latvia and labor force participation rate among population between the ages 30 and 34 in the United States with a correlation coefficient (R) of 0.413 and weighted average of 85.9%. Similarly, the statistical analysis conducted on geographies consisting of 493,185,438 people shows a poor positive correlation between the proportion of Cherokee and labor force participation rate among population between the ages 30 and 34 in the United States with a correlation coefficient (R) of 0.100 and weighted average of 81.6%, a difference of 5.2%.
In Labor Force | Age 30-34 Correlation Summary
| Measurement | Immigrants from Latvia | Cherokee |
| Minimum | 68.8% | 44.6% |
| Maximum | 100.0% | 100.0% |
| Range | 31.2% | 55.4% |
| Mean | 90.0% | 78.0% |
| Median | 87.6% | 79.0% |
| Interquartile 25% (IQ1) | 85.5% | 71.7% |
| Interquartile 75% (IQ3) | 100.0% | 83.3% |
| Interquartile Range (IQR) | 14.5% | 11.6% |
| Standard Deviation (Sample) | 8.2% | 13.1% |
| Standard Deviation (Population) | 8.0% | 13.0% |
Similar Demographics by In Labor Force | Age 30-34
Demographics Similar to Immigrants from Latvia by In Labor Force | Age 30-34
In terms of in labor force | age 30-34, the demographic groups most similar to Immigrants from Latvia are Tsimshian (85.8%, a difference of 0.030%), Immigrants from Liberia (85.9%, a difference of 0.040%), Immigrants from Eastern Africa (85.9%, a difference of 0.060%), Immigrants from Hong Kong (85.8%, a difference of 0.060%), and Immigrants from Eritrea (85.9%, a difference of 0.070%).
| Demographics | Rating | Rank | In Labor Force | Age 30-34 |
| Immigrants | Bulgaria | 100.0 /100 | #21 | Exceptional 86.0% |
| Bermudans | 100.0 /100 | #22 | Exceptional 85.9% |
| Estonians | 100.0 /100 | #23 | Exceptional 85.9% |
| Immigrants | Eritrea | 100.0 /100 | #24 | Exceptional 85.9% |
| Immigrants | North Macedonia | 100.0 /100 | #25 | Exceptional 85.9% |
| Immigrants | Eastern Africa | 100.0 /100 | #26 | Exceptional 85.9% |
| Immigrants | Liberia | 100.0 /100 | #27 | Exceptional 85.9% |
| Immigrants | Latvia | 100.0 /100 | #28 | Exceptional 85.9% |
| Tsimshian | 100.0 /100 | #29 | Exceptional 85.8% |
| Immigrants | Hong Kong | 100.0 /100 | #30 | Exceptional 85.8% |
| Paraguayans | 99.9 /100 | #31 | Exceptional 85.8% |
| Cypriots | 99.9 /100 | #32 | Exceptional 85.8% |
| Immigrants | Bosnia and Herzegovina | 99.9 /100 | #33 | Exceptional 85.8% |
| Ugandans | 99.9 /100 | #34 | Exceptional 85.8% |
| Serbians | 99.9 /100 | #35 | Exceptional 85.8% |
Demographics Similar to Cherokee by In Labor Force | Age 30-34
In terms of in labor force | age 30-34, the demographic groups most similar to Cherokee are Alaskan Athabascan (81.7%, a difference of 0.10%), Immigrants from the Azores (81.5%, a difference of 0.15%), Arapaho (81.5%, a difference of 0.16%), Choctaw (81.4%, a difference of 0.23%), and Shoshone (81.4%, a difference of 0.24%).
| Demographics | Rating | Rank | In Labor Force | Age 30-34 |
| Puget Sound Salish | 0.0 /100 | #308 | Tragic 82.1% |
| Immigrants | Mexico | 0.0 /100 | #309 | Tragic 82.0% |
| Cajuns | 0.0 /100 | #310 | Tragic 82.0% |
| Chickasaw | 0.0 /100 | #311 | Tragic 81.9% |
| Mexicans | 0.0 /100 | #312 | Tragic 81.9% |
| Iroquois | 0.0 /100 | #313 | Tragic 81.9% |
| Alaskan Athabascans | 0.0 /100 | #314 | Tragic 81.7% |
| Cherokee | 0.0 /100 | #315 | Tragic 81.6% |
| Immigrants | Azores | 0.0 /100 | #316 | Tragic 81.5% |
| Arapaho | 0.0 /100 | #317 | Tragic 81.5% |
| Choctaw | 0.0 /100 | #318 | Tragic 81.4% |
| Shoshone | 0.0 /100 | #319 | Tragic 81.4% |
| Yaqui | 0.0 /100 | #320 | Tragic 81.4% |
| Alaska Natives | 0.0 /100 | #321 | Tragic 81.3% |
| Puerto Ricans | 0.0 /100 | #322 | Tragic 81.2% |