Immigrants from Latvia vs Jordanian In Labor Force | Age 30-34
COMPARE
Immigrants from Latvia
Jordanian
In Labor Force | Age 30-34
In Labor Force | Age 30-34 Comparison
Immigrants from Latvia
Jordanians
85.9%
IN LABOR FORCE | AGE 30-34
100.0/ 100
METRIC RATING
28th/ 347
METRIC RANK
85.0%
IN LABOR FORCE | AGE 30-34
88.6/ 100
METRIC RATING
136th/ 347
METRIC RANK
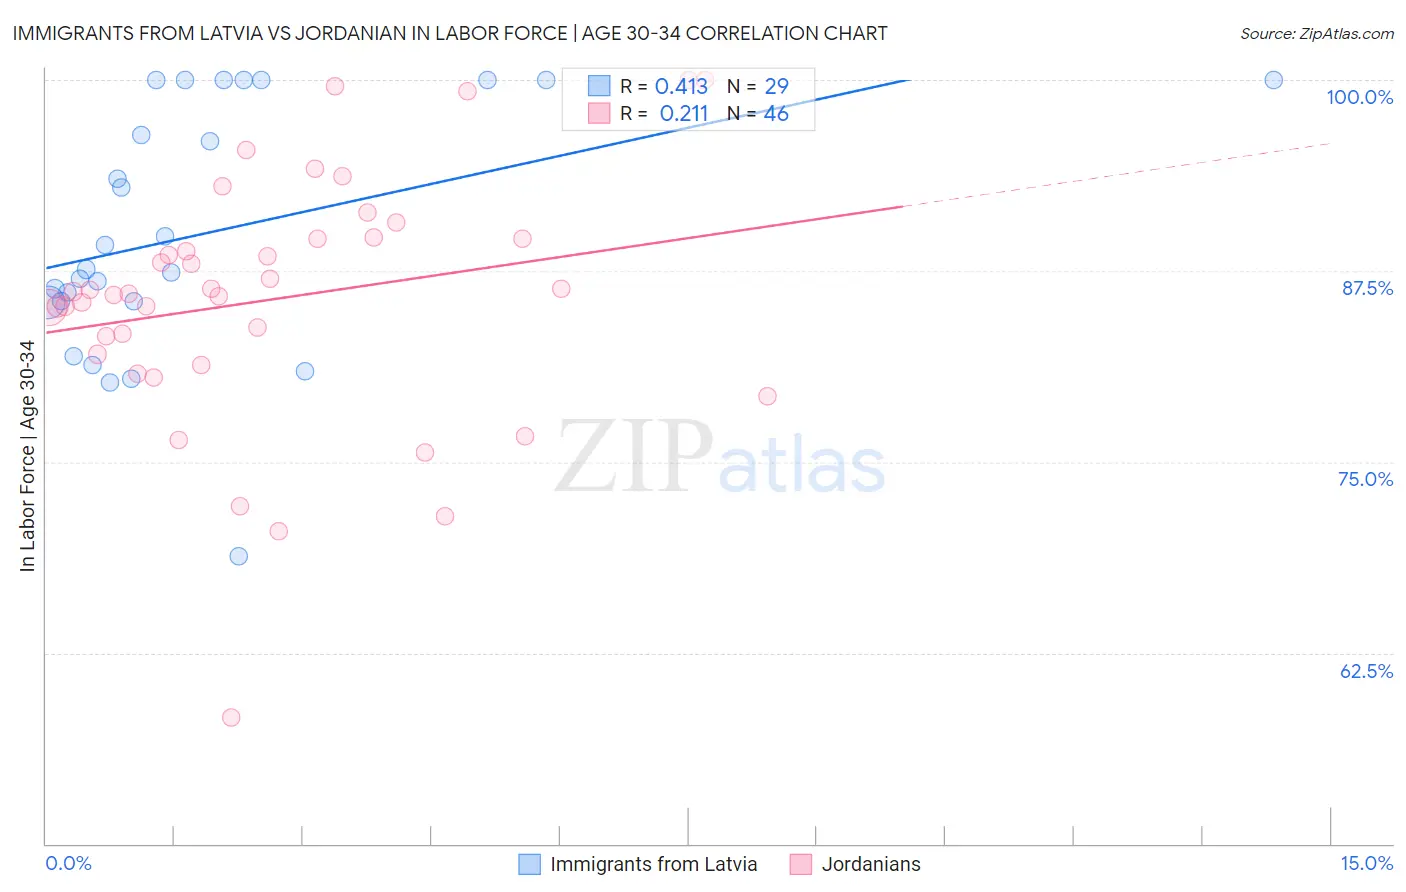
Immigrants from Latvia vs Jordanian In Labor Force | Age 30-34 Correlation Chart
The statistical analysis conducted on geographies consisting of 113,732,113 people shows a moderate positive correlation between the proportion of Immigrants from Latvia and labor force participation rate among population between the ages 30 and 34 in the United States with a correlation coefficient (R) of 0.413 and weighted average of 85.9%. Similarly, the statistical analysis conducted on geographies consisting of 166,400,430 people shows a weak positive correlation between the proportion of Jordanians and labor force participation rate among population between the ages 30 and 34 in the United States with a correlation coefficient (R) of 0.211 and weighted average of 85.0%, a difference of 1.0%.
In Labor Force | Age 30-34 Correlation Summary
| Measurement | Immigrants from Latvia | Jordanian |
| Minimum | 68.8% | 58.3% |
| Maximum | 100.0% | 100.0% |
| Range | 31.2% | 41.7% |
| Mean | 90.0% | 85.6% |
| Median | 87.6% | 86.1% |
| Interquartile 25% (IQ1) | 85.5% | 82.0% |
| Interquartile 75% (IQ3) | 100.0% | 89.6% |
| Interquartile Range (IQR) | 14.5% | 7.6% |
| Standard Deviation (Sample) | 8.2% | 8.2% |
| Standard Deviation (Population) | 8.0% | 8.1% |
Similar Demographics by In Labor Force | Age 30-34
Demographics Similar to Immigrants from Latvia by In Labor Force | Age 30-34
In terms of in labor force | age 30-34, the demographic groups most similar to Immigrants from Latvia are Tsimshian (85.8%, a difference of 0.030%), Immigrants from Liberia (85.9%, a difference of 0.040%), Immigrants from Eastern Africa (85.9%, a difference of 0.060%), Immigrants from Hong Kong (85.8%, a difference of 0.060%), and Immigrants from Eritrea (85.9%, a difference of 0.070%).
| Demographics | Rating | Rank | In Labor Force | Age 30-34 |
| Immigrants | Bulgaria | 100.0 /100 | #21 | Exceptional 86.0% |
| Bermudans | 100.0 /100 | #22 | Exceptional 85.9% |
| Estonians | 100.0 /100 | #23 | Exceptional 85.9% |
| Immigrants | Eritrea | 100.0 /100 | #24 | Exceptional 85.9% |
| Immigrants | North Macedonia | 100.0 /100 | #25 | Exceptional 85.9% |
| Immigrants | Eastern Africa | 100.0 /100 | #26 | Exceptional 85.9% |
| Immigrants | Liberia | 100.0 /100 | #27 | Exceptional 85.9% |
| Immigrants | Latvia | 100.0 /100 | #28 | Exceptional 85.9% |
| Tsimshian | 100.0 /100 | #29 | Exceptional 85.8% |
| Immigrants | Hong Kong | 100.0 /100 | #30 | Exceptional 85.8% |
| Paraguayans | 99.9 /100 | #31 | Exceptional 85.8% |
| Cypriots | 99.9 /100 | #32 | Exceptional 85.8% |
| Immigrants | Bosnia and Herzegovina | 99.9 /100 | #33 | Exceptional 85.8% |
| Ugandans | 99.9 /100 | #34 | Exceptional 85.8% |
| Serbians | 99.9 /100 | #35 | Exceptional 85.8% |
Demographics Similar to Jordanians by In Labor Force | Age 30-34
In terms of in labor force | age 30-34, the demographic groups most similar to Jordanians are Immigrants from Chile (85.0%, a difference of 0.010%), Immigrants from Asia (85.0%, a difference of 0.010%), South African (85.0%, a difference of 0.010%), Sri Lankan (85.0%, a difference of 0.010%), and Chinese (85.0%, a difference of 0.020%).
| Demographics | Rating | Rank | In Labor Force | Age 30-34 |
| Immigrants | Western Africa | 90.2 /100 | #129 | Exceptional 85.0% |
| Immigrants | Spain | 90.0 /100 | #130 | Exceptional 85.0% |
| Chinese | 89.6 /100 | #131 | Excellent 85.0% |
| Immigrants | Israel | 89.5 /100 | #132 | Excellent 85.0% |
| New Zealanders | 89.5 /100 | #133 | Excellent 85.0% |
| Immigrants | Chile | 89.2 /100 | #134 | Excellent 85.0% |
| Immigrants | Asia | 88.9 /100 | #135 | Excellent 85.0% |
| Jordanians | 88.6 /100 | #136 | Excellent 85.0% |
| South Africans | 88.0 /100 | #137 | Excellent 85.0% |
| Sri Lankans | 87.8 /100 | #138 | Excellent 85.0% |
| Bhutanese | 87.5 /100 | #139 | Excellent 85.0% |
| Immigrants | Vietnam | 86.5 /100 | #140 | Excellent 85.0% |
| Chileans | 85.3 /100 | #141 | Excellent 84.9% |
| Immigrants | Indonesia | 84.3 /100 | #142 | Excellent 84.9% |
| Colombians | 82.2 /100 | #143 | Excellent 84.9% |