Immigrants from Taiwan vs Cherokee In Labor Force | Age 30-34
COMPARE
Immigrants from Taiwan
Cherokee
In Labor Force | Age 30-34
In Labor Force | Age 30-34 Comparison
Immigrants from Taiwan
Cherokee
85.3%
IN LABOR FORCE | AGE 30-34
98.3/ 100
METRIC RATING
86th/ 347
METRIC RANK
81.6%
IN LABOR FORCE | AGE 30-34
0.0/ 100
METRIC RATING
315th/ 347
METRIC RANK
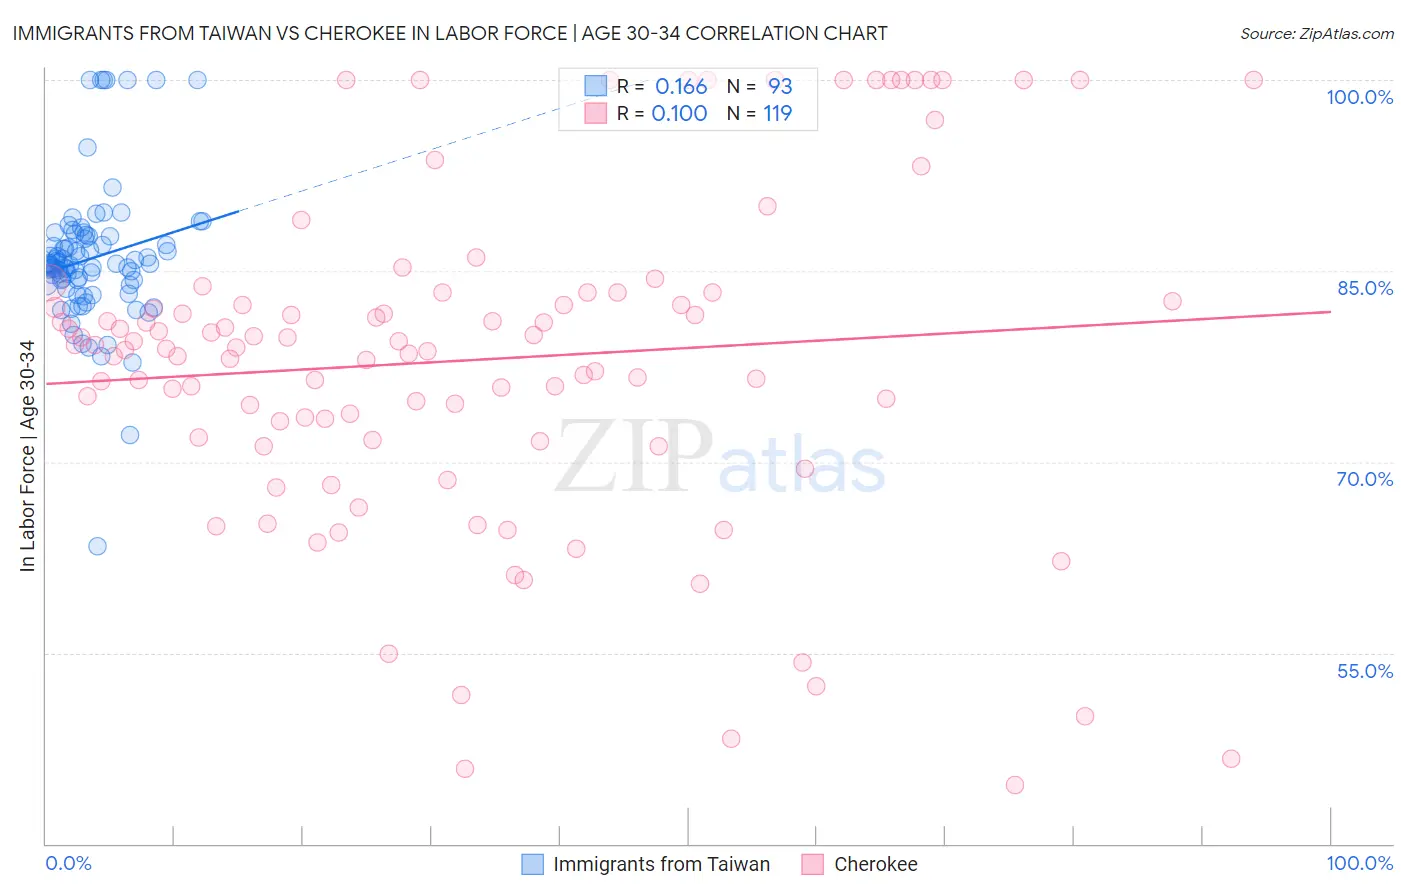
Immigrants from Taiwan vs Cherokee In Labor Force | Age 30-34 Correlation Chart
The statistical analysis conducted on geographies consisting of 298,154,729 people shows a poor positive correlation between the proportion of Immigrants from Taiwan and labor force participation rate among population between the ages 30 and 34 in the United States with a correlation coefficient (R) of 0.166 and weighted average of 85.3%. Similarly, the statistical analysis conducted on geographies consisting of 493,185,438 people shows a poor positive correlation between the proportion of Cherokee and labor force participation rate among population between the ages 30 and 34 in the United States with a correlation coefficient (R) of 0.100 and weighted average of 81.6%, a difference of 4.5%.
In Labor Force | Age 30-34 Correlation Summary
| Measurement | Immigrants from Taiwan | Cherokee |
| Minimum | 63.4% | 44.6% |
| Maximum | 100.0% | 100.0% |
| Range | 36.6% | 55.4% |
| Mean | 86.0% | 78.0% |
| Median | 85.5% | 79.0% |
| Interquartile 25% (IQ1) | 84.0% | 71.7% |
| Interquartile 75% (IQ3) | 87.7% | 83.3% |
| Interquartile Range (IQR) | 3.7% | 11.6% |
| Standard Deviation (Sample) | 5.5% | 13.1% |
| Standard Deviation (Population) | 5.5% | 13.0% |
Similar Demographics by In Labor Force | Age 30-34
Demographics Similar to Immigrants from Taiwan by In Labor Force | Age 30-34
In terms of in labor force | age 30-34, the demographic groups most similar to Immigrants from Taiwan are Immigrants from Northern Europe (85.3%, a difference of 0.0%), Immigrants from Belgium (85.3%, a difference of 0.010%), Mongolian (85.3%, a difference of 0.020%), Immigrants from Kazakhstan (85.3%, a difference of 0.020%), and Greek (85.3%, a difference of 0.030%).
| Demographics | Rating | Rank | In Labor Force | Age 30-34 |
| Immigrants | Switzerland | 98.7 /100 | #79 | Exceptional 85.3% |
| Immigrants | Russia | 98.7 /100 | #80 | Exceptional 85.3% |
| Slovaks | 98.7 /100 | #81 | Exceptional 85.3% |
| Immigrants | Africa | 98.6 /100 | #82 | Exceptional 85.3% |
| Immigrants | Europe | 98.6 /100 | #83 | Exceptional 85.3% |
| Greeks | 98.6 /100 | #84 | Exceptional 85.3% |
| Mongolians | 98.5 /100 | #85 | Exceptional 85.3% |
| Immigrants | Taiwan | 98.3 /100 | #86 | Exceptional 85.3% |
| Immigrants | Northern Europe | 98.2 /100 | #87 | Exceptional 85.3% |
| Immigrants | Belgium | 98.2 /100 | #88 | Exceptional 85.3% |
| Immigrants | Kazakhstan | 98.1 /100 | #89 | Exceptional 85.3% |
| Burmese | 97.9 /100 | #90 | Exceptional 85.3% |
| Immigrants | Moldova | 97.9 /100 | #91 | Exceptional 85.3% |
| German Russians | 97.7 /100 | #92 | Exceptional 85.2% |
| Immigrants | Norway | 97.6 /100 | #93 | Exceptional 85.2% |
Demographics Similar to Cherokee by In Labor Force | Age 30-34
In terms of in labor force | age 30-34, the demographic groups most similar to Cherokee are Alaskan Athabascan (81.7%, a difference of 0.10%), Immigrants from the Azores (81.5%, a difference of 0.15%), Arapaho (81.5%, a difference of 0.16%), Choctaw (81.4%, a difference of 0.23%), and Shoshone (81.4%, a difference of 0.24%).
| Demographics | Rating | Rank | In Labor Force | Age 30-34 |
| Puget Sound Salish | 0.0 /100 | #308 | Tragic 82.1% |
| Immigrants | Mexico | 0.0 /100 | #309 | Tragic 82.0% |
| Cajuns | 0.0 /100 | #310 | Tragic 82.0% |
| Chickasaw | 0.0 /100 | #311 | Tragic 81.9% |
| Mexicans | 0.0 /100 | #312 | Tragic 81.9% |
| Iroquois | 0.0 /100 | #313 | Tragic 81.9% |
| Alaskan Athabascans | 0.0 /100 | #314 | Tragic 81.7% |
| Cherokee | 0.0 /100 | #315 | Tragic 81.6% |
| Immigrants | Azores | 0.0 /100 | #316 | Tragic 81.5% |
| Arapaho | 0.0 /100 | #317 | Tragic 81.5% |
| Choctaw | 0.0 /100 | #318 | Tragic 81.4% |
| Shoshone | 0.0 /100 | #319 | Tragic 81.4% |
| Yaqui | 0.0 /100 | #320 | Tragic 81.4% |
| Alaska Natives | 0.0 /100 | #321 | Tragic 81.3% |
| Puerto Ricans | 0.0 /100 | #322 | Tragic 81.2% |