Immigrants from Cabo Verde vs Cherokee In Labor Force | Age 30-34
COMPARE
Immigrants from Cabo Verde
Cherokee
In Labor Force | Age 30-34
In Labor Force | Age 30-34 Comparison
Immigrants from Cabo Verde
Cherokee
86.1%
IN LABOR FORCE | AGE 30-34
100.0/ 100
METRIC RATING
14th/ 347
METRIC RANK
81.6%
IN LABOR FORCE | AGE 30-34
0.0/ 100
METRIC RATING
315th/ 347
METRIC RANK
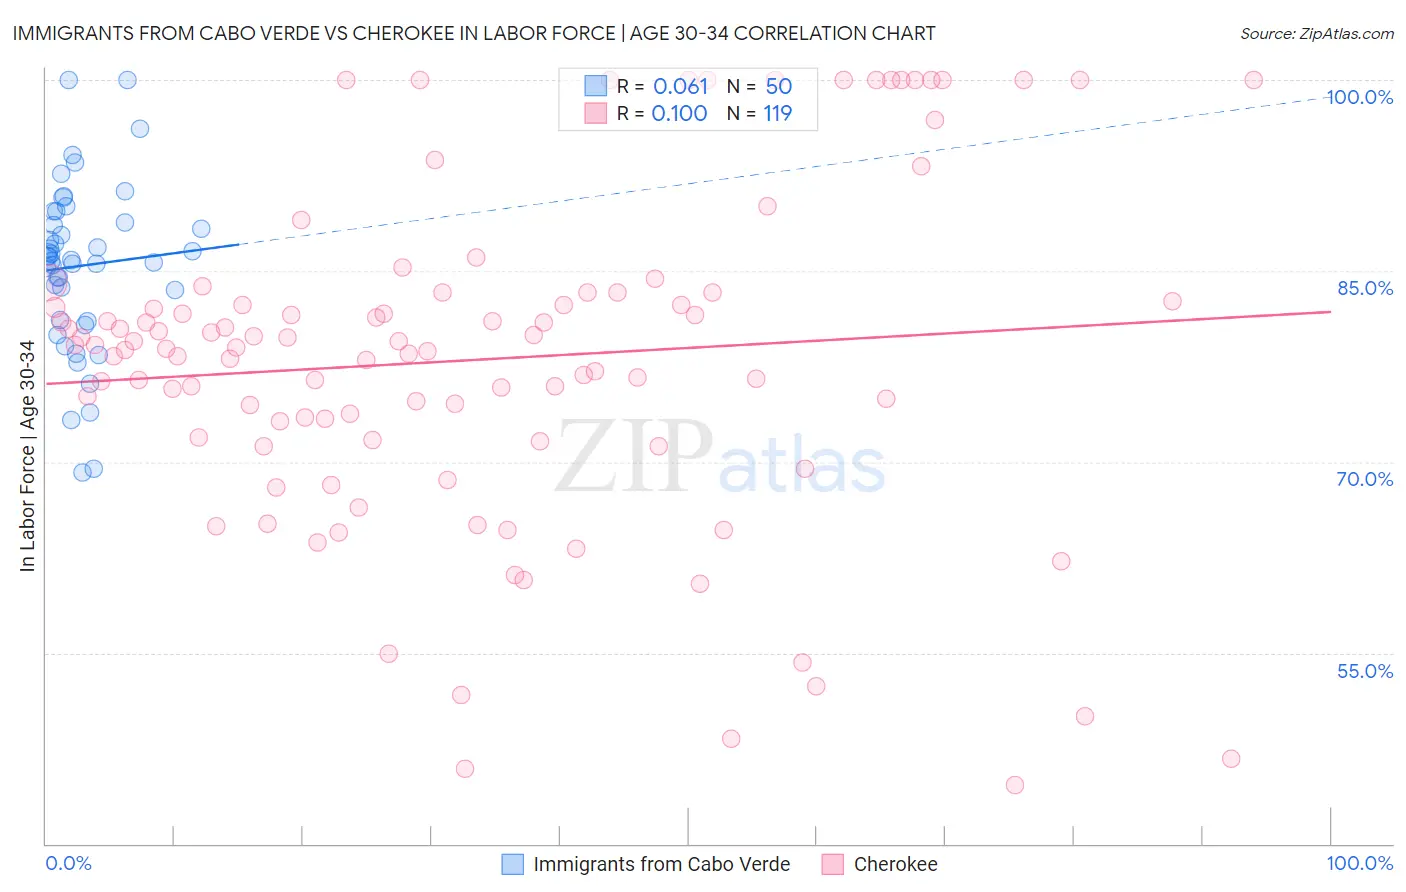
Immigrants from Cabo Verde vs Cherokee In Labor Force | Age 30-34 Correlation Chart
The statistical analysis conducted on geographies consisting of 38,153,074 people shows a slight positive correlation between the proportion of Immigrants from Cabo Verde and labor force participation rate among population between the ages 30 and 34 in the United States with a correlation coefficient (R) of 0.061 and weighted average of 86.1%. Similarly, the statistical analysis conducted on geographies consisting of 493,185,438 people shows a poor positive correlation between the proportion of Cherokee and labor force participation rate among population between the ages 30 and 34 in the United States with a correlation coefficient (R) of 0.100 and weighted average of 81.6%, a difference of 5.5%.
In Labor Force | Age 30-34 Correlation Summary
| Measurement | Immigrants from Cabo Verde | Cherokee |
| Minimum | 69.2% | 44.6% |
| Maximum | 100.0% | 100.0% |
| Range | 30.8% | 55.4% |
| Mean | 85.4% | 78.0% |
| Median | 86.0% | 79.0% |
| Interquartile 25% (IQ1) | 81.2% | 71.7% |
| Interquartile 75% (IQ3) | 88.8% | 83.3% |
| Interquartile Range (IQR) | 7.6% | 11.6% |
| Standard Deviation (Sample) | 6.6% | 13.1% |
| Standard Deviation (Population) | 6.5% | 13.0% |
Similar Demographics by In Labor Force | Age 30-34
Demographics Similar to Immigrants from Cabo Verde by In Labor Force | Age 30-34
In terms of in labor force | age 30-34, the demographic groups most similar to Immigrants from Cabo Verde are Immigrants from Croatia (86.1%, a difference of 0.010%), Immigrants from Albania (86.1%, a difference of 0.010%), Bolivian (86.1%, a difference of 0.020%), Latvian (86.0%, a difference of 0.040%), and Immigrants from Cameroon (86.0%, a difference of 0.050%).
| Demographics | Rating | Rank | In Labor Force | Age 30-34 |
| Immigrants | Bolivia | 100.0 /100 | #7 | Exceptional 86.2% |
| Cambodians | 100.0 /100 | #8 | Exceptional 86.2% |
| Immigrants | Somalia | 100.0 /100 | #9 | Exceptional 86.2% |
| Immigrants | Serbia | 100.0 /100 | #10 | Exceptional 86.2% |
| Carpatho Rusyns | 100.0 /100 | #11 | Exceptional 86.2% |
| Bolivians | 100.0 /100 | #12 | Exceptional 86.1% |
| Immigrants | Croatia | 100.0 /100 | #13 | Exceptional 86.1% |
| Immigrants | Cabo Verde | 100.0 /100 | #14 | Exceptional 86.1% |
| Immigrants | Albania | 100.0 /100 | #15 | Exceptional 86.1% |
| Latvians | 100.0 /100 | #16 | Exceptional 86.0% |
| Immigrants | Cameroon | 100.0 /100 | #17 | Exceptional 86.0% |
| Immigrants | Sierra Leone | 100.0 /100 | #18 | Exceptional 86.0% |
| Sierra Leoneans | 100.0 /100 | #19 | Exceptional 86.0% |
| Bulgarians | 100.0 /100 | #20 | Exceptional 86.0% |
| Immigrants | Bulgaria | 100.0 /100 | #21 | Exceptional 86.0% |
Demographics Similar to Cherokee by In Labor Force | Age 30-34
In terms of in labor force | age 30-34, the demographic groups most similar to Cherokee are Alaskan Athabascan (81.7%, a difference of 0.10%), Immigrants from the Azores (81.5%, a difference of 0.15%), Arapaho (81.5%, a difference of 0.16%), Choctaw (81.4%, a difference of 0.23%), and Shoshone (81.4%, a difference of 0.24%).
| Demographics | Rating | Rank | In Labor Force | Age 30-34 |
| Puget Sound Salish | 0.0 /100 | #308 | Tragic 82.1% |
| Immigrants | Mexico | 0.0 /100 | #309 | Tragic 82.0% |
| Cajuns | 0.0 /100 | #310 | Tragic 82.0% |
| Chickasaw | 0.0 /100 | #311 | Tragic 81.9% |
| Mexicans | 0.0 /100 | #312 | Tragic 81.9% |
| Iroquois | 0.0 /100 | #313 | Tragic 81.9% |
| Alaskan Athabascans | 0.0 /100 | #314 | Tragic 81.7% |
| Cherokee | 0.0 /100 | #315 | Tragic 81.6% |
| Immigrants | Azores | 0.0 /100 | #316 | Tragic 81.5% |
| Arapaho | 0.0 /100 | #317 | Tragic 81.5% |
| Choctaw | 0.0 /100 | #318 | Tragic 81.4% |
| Shoshone | 0.0 /100 | #319 | Tragic 81.4% |
| Yaqui | 0.0 /100 | #320 | Tragic 81.4% |
| Alaska Natives | 0.0 /100 | #321 | Tragic 81.3% |
| Puerto Ricans | 0.0 /100 | #322 | Tragic 81.2% |