Immigrants from Latvia vs Guamanian/Chamorro In Labor Force | Age 30-34
COMPARE
Immigrants from Latvia
Guamanian/Chamorro
In Labor Force | Age 30-34
In Labor Force | Age 30-34 Comparison
Immigrants from Latvia
Guamanians/Chamorros
85.9%
IN LABOR FORCE | AGE 30-34
100.0/ 100
METRIC RATING
28th/ 347
METRIC RANK
83.5%
IN LABOR FORCE | AGE 30-34
0.0/ 100
METRIC RATING
273rd/ 347
METRIC RANK
Immigrants from Latvia vs Guamanian/Chamorro In Labor Force | Age 30-34 Correlation Chart
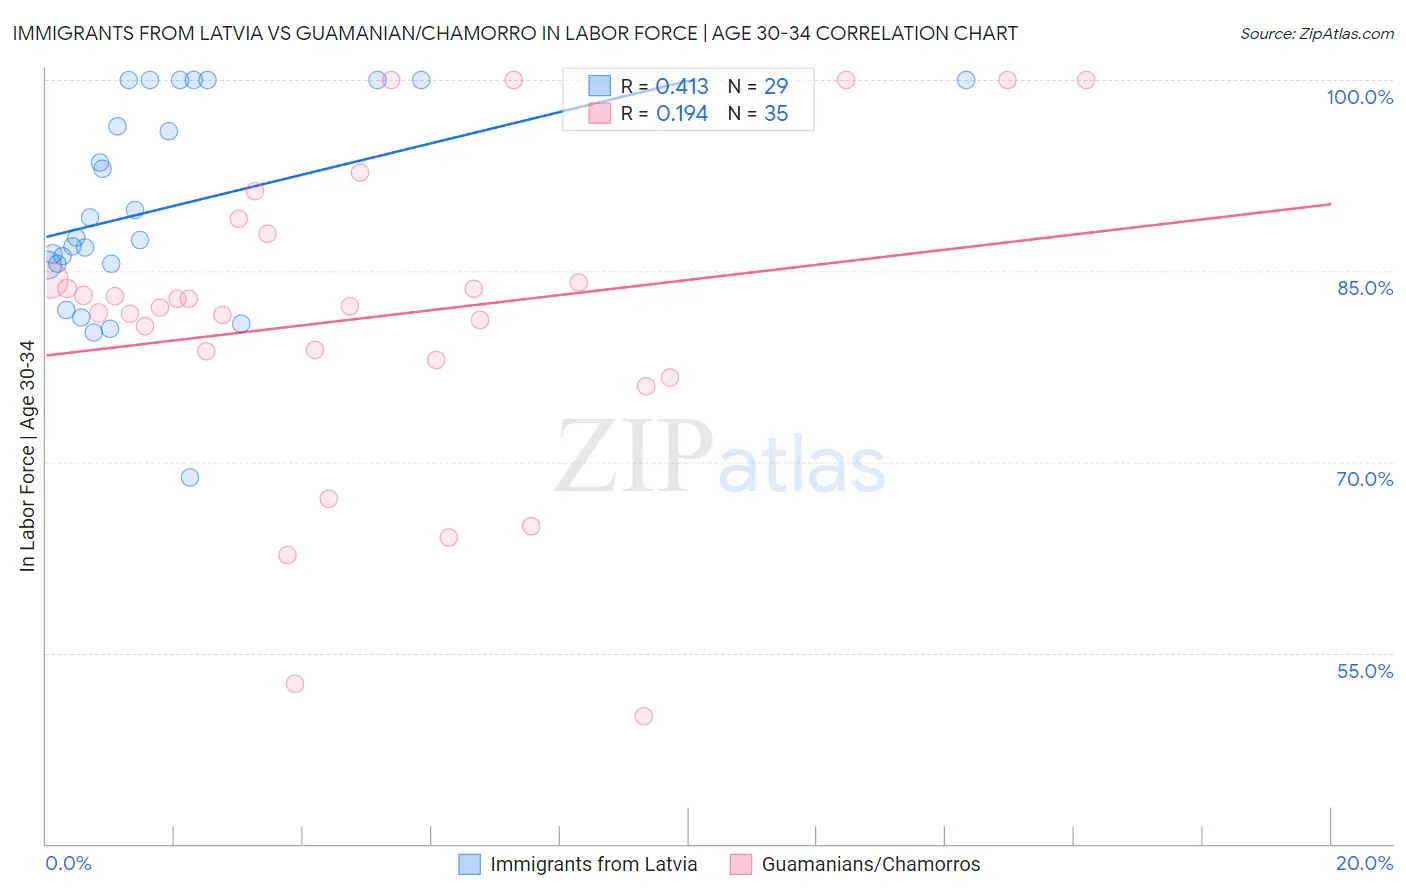
The statistical analysis conducted on geographies consisting of 113,732,113 people shows a moderate positive correlation between the proportion of Immigrants from Latvia and labor force participation rate among population between the ages 30 and 34 in the United States with a correlation coefficient (R) of 0.413 and weighted average of 85.9%. Similarly, the statistical analysis conducted on geographies consisting of 221,913,161 people shows a poor positive correlation between the proportion of Guamanians/Chamorros and labor force participation rate among population between the ages 30 and 34 in the United States with a correlation coefficient (R) of 0.194 and weighted average of 83.5%, a difference of 2.9%.
In Labor Force | Age 30-34 Correlation Summary
| Measurement | Immigrants from Latvia | Guamanian/Chamorro |
| Minimum | 68.8% | 50.0% |
| Maximum | 100.0% | 100.0% |
| Range | 31.2% | 50.0% |
| Mean | 90.0% | 81.4% |
| Median | 87.6% | 82.3% |
| Interquartile 25% (IQ1) | 85.5% | 78.0% |
| Interquartile 75% (IQ3) | 100.0% | 87.9% |
| Interquartile Range (IQR) | 14.5% | 9.9% |
| Standard Deviation (Sample) | 8.2% | 12.3% |
| Standard Deviation (Population) | 8.0% | 12.1% |
Similar Demographics by In Labor Force | Age 30-34
Demographics Similar to Immigrants from Latvia by In Labor Force | Age 30-34
In terms of in labor force | age 30-34, the demographic groups most similar to Immigrants from Latvia are Tsimshian (85.8%, a difference of 0.030%), Immigrants from Liberia (85.9%, a difference of 0.040%), Immigrants from Eastern Africa (85.9%, a difference of 0.060%), Immigrants from Hong Kong (85.8%, a difference of 0.060%), and Immigrants from Eritrea (85.9%, a difference of 0.070%).
| Demographics | Rating | Rank | In Labor Force | Age 30-34 |
| Immigrants | Bulgaria | 100.0 /100 | #21 | Exceptional 86.0% |
| Bermudans | 100.0 /100 | #22 | Exceptional 85.9% |
| Estonians | 100.0 /100 | #23 | Exceptional 85.9% |
| Immigrants | Eritrea | 100.0 /100 | #24 | Exceptional 85.9% |
| Immigrants | North Macedonia | 100.0 /100 | #25 | Exceptional 85.9% |
| Immigrants | Eastern Africa | 100.0 /100 | #26 | Exceptional 85.9% |
| Immigrants | Liberia | 100.0 /100 | #27 | Exceptional 85.9% |
| Immigrants | Latvia | 100.0 /100 | #28 | Exceptional 85.9% |
| Tsimshian | 100.0 /100 | #29 | Exceptional 85.8% |
| Immigrants | Hong Kong | 100.0 /100 | #30 | Exceptional 85.8% |
| Paraguayans | 99.9 /100 | #31 | Exceptional 85.8% |
| Cypriots | 99.9 /100 | #32 | Exceptional 85.8% |
| Immigrants | Bosnia and Herzegovina | 99.9 /100 | #33 | Exceptional 85.8% |
| Ugandans | 99.9 /100 | #34 | Exceptional 85.8% |
| Serbians | 99.9 /100 | #35 | Exceptional 85.8% |
Demographics Similar to Guamanians/Chamorros by In Labor Force | Age 30-34
In terms of in labor force | age 30-34, the demographic groups most similar to Guamanians/Chamorros are Belizean (83.5%, a difference of 0.010%), Immigrants from Grenada (83.5%, a difference of 0.020%), Tongan (83.5%, a difference of 0.020%), Delaware (83.5%, a difference of 0.040%), and Spanish (83.5%, a difference of 0.050%).
| Demographics | Rating | Rank | In Labor Force | Age 30-34 |
| Immigrants | Guatemala | 0.1 /100 | #266 | Tragic 83.7% |
| Spaniards | 0.1 /100 | #267 | Tragic 83.6% |
| Immigrants | Bangladesh | 0.1 /100 | #268 | Tragic 83.6% |
| Vietnamese | 0.1 /100 | #269 | Tragic 83.6% |
| Spanish Americans | 0.0 /100 | #270 | Tragic 83.5% |
| Spanish | 0.0 /100 | #271 | Tragic 83.5% |
| Immigrants | Nonimmigrants | 0.0 /100 | #272 | Tragic 83.5% |
| Guamanians/Chamorros | 0.0 /100 | #273 | Tragic 83.5% |
| Belizeans | 0.0 /100 | #274 | Tragic 83.5% |
| Immigrants | Grenada | 0.0 /100 | #275 | Tragic 83.5% |
| Tongans | 0.0 /100 | #276 | Tragic 83.5% |
| Delaware | 0.0 /100 | #277 | Tragic 83.5% |
| Fijians | 0.0 /100 | #278 | Tragic 83.4% |
| Immigrants | Fiji | 0.0 /100 | #279 | Tragic 83.4% |
| Africans | 0.0 /100 | #280 | Tragic 83.4% |