Immigrants from Laos vs Estonian In Labor Force | Age 20-64
COMPARE
Immigrants from Laos
Estonian
In Labor Force | Age 20-64
In Labor Force | Age 20-64 Comparison
Immigrants from Laos
Estonians
79.4%
IN LABOR FORCE | AGE 20-64
21.5/ 100
METRIC RATING
198th/ 347
METRIC RANK
80.0%
IN LABOR FORCE | AGE 20-64
94.0/ 100
METRIC RATING
110th/ 347
METRIC RANK
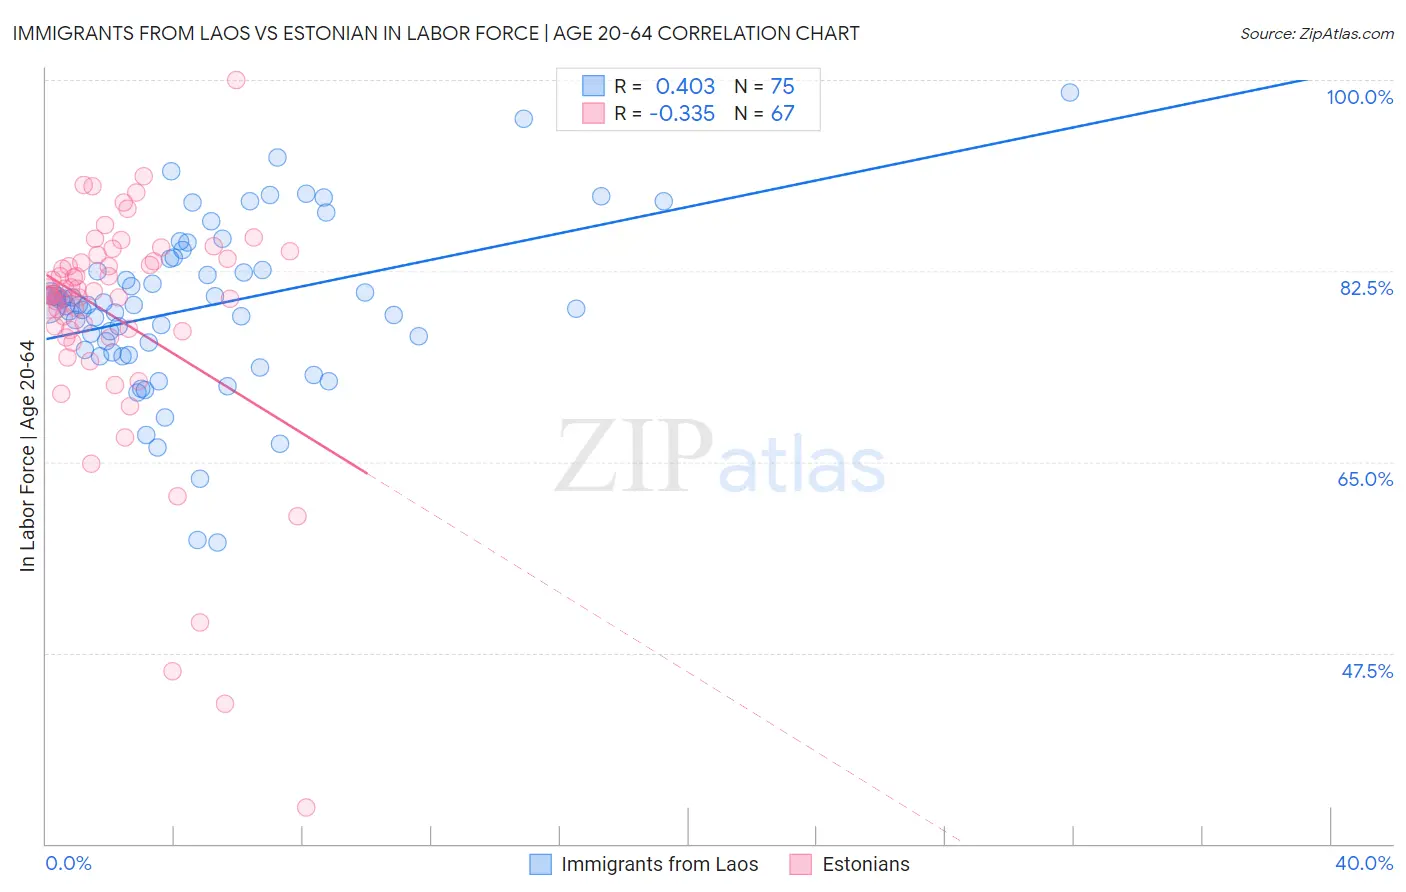
Immigrants from Laos vs Estonian In Labor Force | Age 20-64 Correlation Chart
The statistical analysis conducted on geographies consisting of 201,472,341 people shows a moderate positive correlation between the proportion of Immigrants from Laos and labor force participation rate among population between the ages 20 and 64 in the United States with a correlation coefficient (R) of 0.403 and weighted average of 79.4%. Similarly, the statistical analysis conducted on geographies consisting of 123,512,099 people shows a mild negative correlation between the proportion of Estonians and labor force participation rate among population between the ages 20 and 64 in the United States with a correlation coefficient (R) of -0.335 and weighted average of 80.0%, a difference of 0.81%.
In Labor Force | Age 20-64 Correlation Summary
| Measurement | Immigrants from Laos | Estonian |
| Minimum | 57.6% | 33.3% |
| Maximum | 98.9% | 100.0% |
| Range | 41.3% | 66.7% |
| Mean | 79.3% | 78.1% |
| Median | 79.4% | 80.4% |
| Interquartile 25% (IQ1) | 75.1% | 76.4% |
| Interquartile 75% (IQ3) | 83.6% | 83.6% |
| Interquartile Range (IQR) | 8.5% | 7.2% |
| Standard Deviation (Sample) | 7.7% | 11.2% |
| Standard Deviation (Population) | 7.6% | 11.1% |
Similar Demographics by In Labor Force | Age 20-64
Demographics Similar to Immigrants from Laos by In Labor Force | Age 20-64
In terms of in labor force | age 20-64, the demographic groups most similar to Immigrants from Laos are Immigrants from Senegal (79.4%, a difference of 0.010%), Ecuadorian (79.4%, a difference of 0.020%), Dutch (79.3%, a difference of 0.020%), Immigrants from Austria (79.4%, a difference of 0.030%), and Immigrants from Oceania (79.3%, a difference of 0.030%).
| Demographics | Rating | Rank | In Labor Force | Age 20-64 |
| Swiss | 28.9 /100 | #191 | Fair 79.4% |
| Immigrants | Denmark | 26.9 /100 | #192 | Fair 79.4% |
| Indonesians | 26.1 /100 | #193 | Fair 79.4% |
| Immigrants | Thailand | 24.8 /100 | #194 | Fair 79.4% |
| Immigrants | Austria | 23.7 /100 | #195 | Fair 79.4% |
| Ecuadorians | 23.1 /100 | #196 | Fair 79.4% |
| Immigrants | Senegal | 22.5 /100 | #197 | Fair 79.4% |
| Immigrants | Laos | 21.5 /100 | #198 | Fair 79.4% |
| Dutch | 20.2 /100 | #199 | Fair 79.3% |
| Immigrants | Oceania | 19.1 /100 | #200 | Poor 79.3% |
| Immigrants | Nicaragua | 19.0 /100 | #201 | Poor 79.3% |
| Nicaraguans | 18.3 /100 | #202 | Poor 79.3% |
| Iraqis | 17.7 /100 | #203 | Poor 79.3% |
| Immigrants | Cambodia | 17.6 /100 | #204 | Poor 79.3% |
| Immigrants | Congo | 17.5 /100 | #205 | Poor 79.3% |
Demographics Similar to Estonians by In Labor Force | Age 20-64
In terms of in labor force | age 20-64, the demographic groups most similar to Estonians are Immigrants from Argentina (80.0%, a difference of 0.0%), Immigrants from South America (80.0%, a difference of 0.0%), Immigrants from Italy (80.0%, a difference of 0.0%), Sri Lankan (80.0%, a difference of 0.0%), and Iranian (80.0%, a difference of 0.010%).
| Demographics | Rating | Rank | In Labor Force | Age 20-64 |
| Russians | 95.5 /100 | #103 | Exceptional 80.0% |
| Venezuelans | 95.3 /100 | #104 | Exceptional 80.0% |
| Immigrants | Ghana | 95.0 /100 | #105 | Exceptional 80.0% |
| Greeks | 94.8 /100 | #106 | Exceptional 80.0% |
| Immigrants | Jordan | 94.8 /100 | #107 | Exceptional 80.0% |
| Iranians | 94.3 /100 | #108 | Exceptional 80.0% |
| Immigrants | Argentina | 94.1 /100 | #109 | Exceptional 80.0% |
| Estonians | 94.0 /100 | #110 | Exceptional 80.0% |
| Immigrants | South America | 93.9 /100 | #111 | Exceptional 80.0% |
| Immigrants | Italy | 93.9 /100 | #112 | Exceptional 80.0% |
| Sri Lankans | 93.9 /100 | #113 | Exceptional 80.0% |
| Argentineans | 93.8 /100 | #114 | Exceptional 80.0% |
| Bermudans | 93.3 /100 | #115 | Exceptional 80.0% |
| Immigrants | Western Africa | 93.1 /100 | #116 | Exceptional 80.0% |
| Immigrants | Vietnam | 92.7 /100 | #117 | Exceptional 80.0% |