Immigrants from Laos vs Scotch-Irish Householder Income Under 25 years
COMPARE
Immigrants from Laos
Scotch-Irish
Householder Income Under 25 years
Householder Income Under 25 years Comparison
Immigrants from Laos
Scotch-Irish
$50,041
HOUSEHOLDER INCOME UNDER 25 YEARS
0.5/ 100
METRIC RATING
267th/ 347
METRIC RANK
$49,039
HOUSEHOLDER INCOME UNDER 25 YEARS
0.0/ 100
METRIC RATING
285th/ 347
METRIC RANK
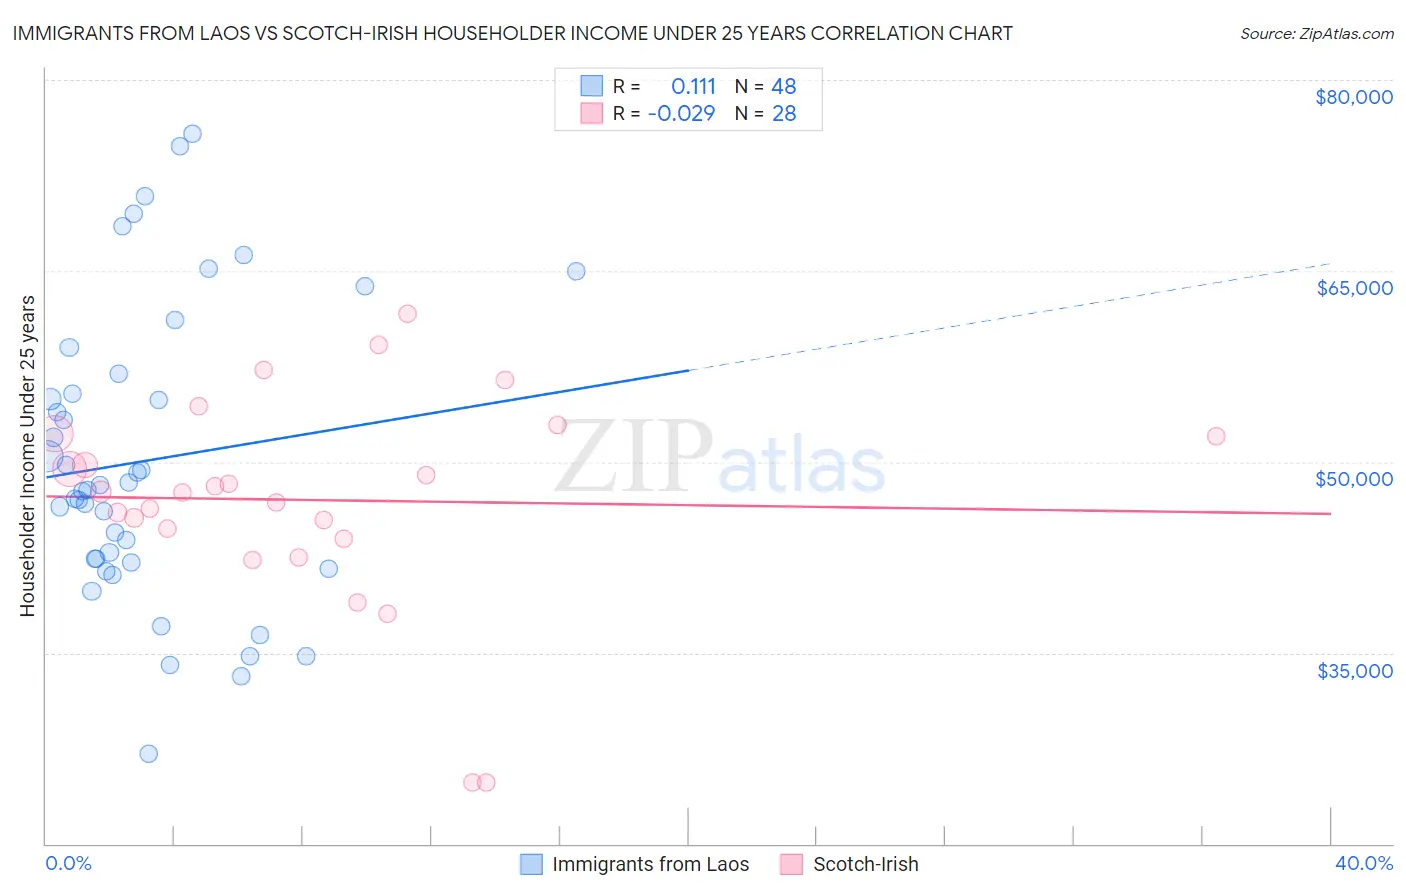
Immigrants from Laos vs Scotch-Irish Householder Income Under 25 years Correlation Chart
The statistical analysis conducted on geographies consisting of 183,790,099 people shows a poor positive correlation between the proportion of Immigrants from Laos and household income with householder under the age of 25 in the United States with a correlation coefficient (R) of 0.111 and weighted average of $50,041. Similarly, the statistical analysis conducted on geographies consisting of 427,674,236 people shows no correlation between the proportion of Scotch-Irish and household income with householder under the age of 25 in the United States with a correlation coefficient (R) of -0.029 and weighted average of $49,039, a difference of 2.0%.
Householder Income Under 25 years Correlation Summary
| Measurement | Immigrants from Laos | Scotch-Irish |
| Minimum | $27,039 | $24,821 |
| Maximum | $75,734 | $61,601 |
| Range | $48,695 | $36,780 |
| Mean | $50,097 | $47,004 |
| Median | $48,012 | $47,645 |
| Interquartile 25% (IQ1) | $42,252 | $44,331 |
| Interquartile 75% (IQ3) | $56,151 | $52,103 |
| Interquartile Range (IQR) | $13,899 | $7,772 |
| Standard Deviation (Sample) | $11,568 | $8,411 |
| Standard Deviation (Population) | $11,447 | $8,259 |
Demographics Similar to Immigrants from Laos and Scotch-Irish by Householder Income Under 25 years
In terms of householder income under 25 years, the demographic groups most similar to Immigrants from Laos are Venezuelan ($50,011, a difference of 0.060%), Ute ($49,997, a difference of 0.090%), Mexican ($49,989, a difference of 0.10%), Immigrants from Venezuela ($50,109, a difference of 0.14%), and Taiwanese ($49,804, a difference of 0.48%). Similarly, the demographic groups most similar to Scotch-Irish are French American Indian ($48,977, a difference of 0.13%), Carpatho Rusyn ($49,113, a difference of 0.15%), Immigrants from Nigeria ($49,174, a difference of 0.28%), Alsatian ($49,267, a difference of 0.46%), and Nonimmigrants ($49,348, a difference of 0.63%).
| Demographics | Rating | Rank | Householder Income Under 25 years |
| Immigrants | Venezuela | 0.6 /100 | #266 | Tragic $50,109 |
| Immigrants | Laos | 0.5 /100 | #267 | Tragic $50,041 |
| Venezuelans | 0.5 /100 | #268 | Tragic $50,011 |
| Ute | 0.5 /100 | #269 | Tragic $49,997 |
| Mexicans | 0.5 /100 | #270 | Tragic $49,989 |
| Taiwanese | 0.3 /100 | #271 | Tragic $49,804 |
| Colville | 0.3 /100 | #272 | Tragic $49,774 |
| Slovaks | 0.3 /100 | #273 | Tragic $49,753 |
| Immigrants | Senegal | 0.3 /100 | #274 | Tragic $49,742 |
| Immigrants | Kenya | 0.2 /100 | #275 | Tragic $49,633 |
| Dominicans | 0.2 /100 | #276 | Tragic $49,633 |
| Immigrants | Western Africa | 0.2 /100 | #277 | Tragic $49,621 |
| Nigerians | 0.1 /100 | #278 | Tragic $49,416 |
| Apache | 0.1 /100 | #279 | Tragic $49,395 |
| Hmong | 0.1 /100 | #280 | Tragic $49,364 |
| Immigrants | Nonimmigrants | 0.1 /100 | #281 | Tragic $49,348 |
| Alsatians | 0.1 /100 | #282 | Tragic $49,267 |
| Immigrants | Nigeria | 0.1 /100 | #283 | Tragic $49,174 |
| Carpatho Rusyns | 0.1 /100 | #284 | Tragic $49,113 |
| Scotch-Irish | 0.0 /100 | #285 | Tragic $49,039 |
| French American Indians | 0.0 /100 | #286 | Tragic $48,977 |