Colombian vs Immigrants from North Macedonia In Labor Force | Age 30-34
COMPARE
Colombian
Immigrants from North Macedonia
In Labor Force | Age 30-34
In Labor Force | Age 30-34 Comparison
Colombians
Immigrants from North Macedonia
84.9%
IN LABOR FORCE | AGE 30-34
82.2/ 100
METRIC RATING
143rd/ 347
METRIC RANK
85.9%
IN LABOR FORCE | AGE 30-34
100.0/ 100
METRIC RATING
25th/ 347
METRIC RANK
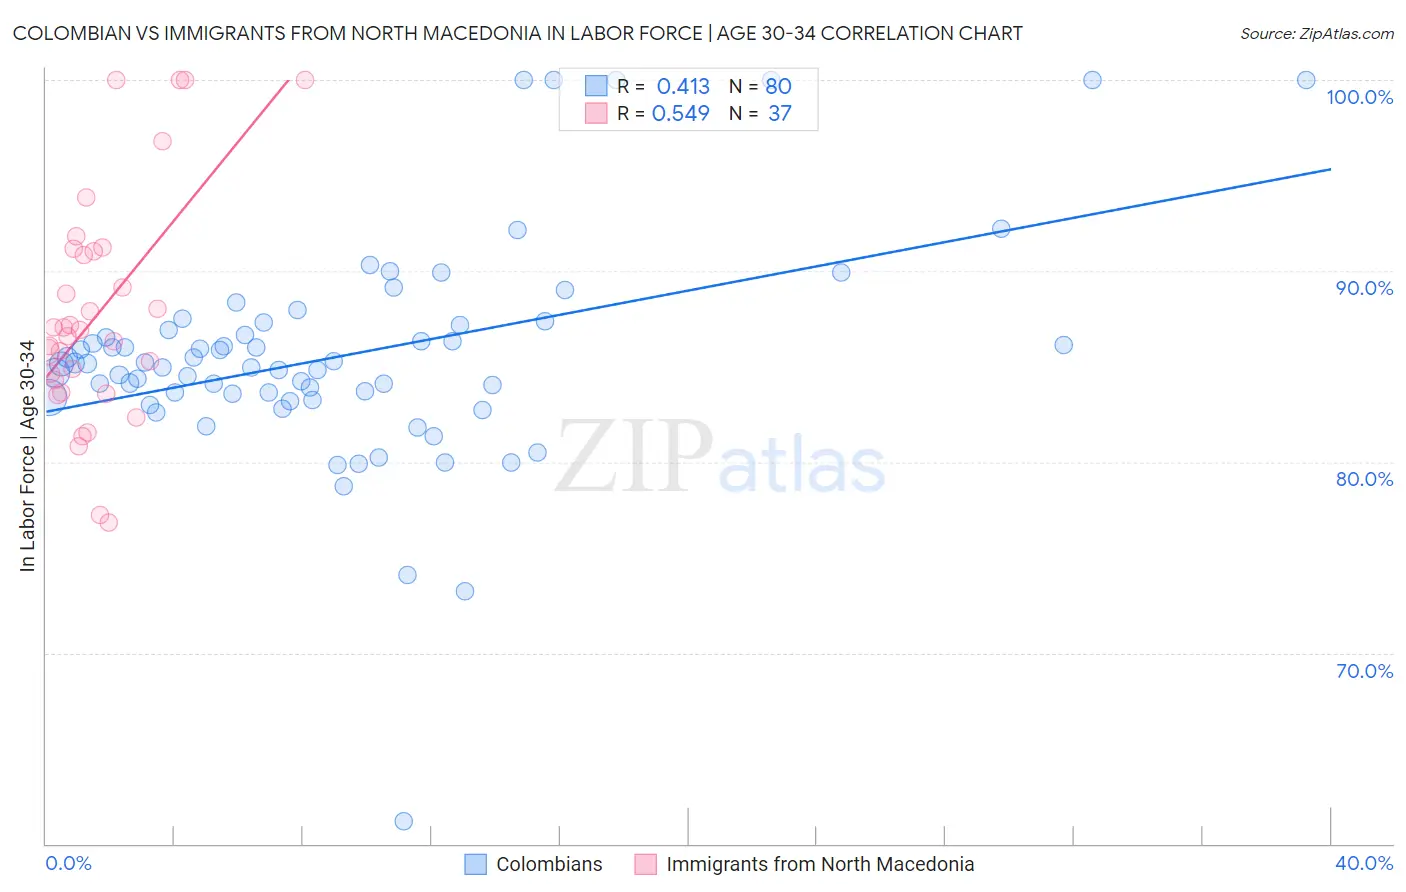
Colombian vs Immigrants from North Macedonia In Labor Force | Age 30-34 Correlation Chart
The statistical analysis conducted on geographies consisting of 419,380,718 people shows a moderate positive correlation between the proportion of Colombians and labor force participation rate among population between the ages 30 and 34 in the United States with a correlation coefficient (R) of 0.413 and weighted average of 84.9%. Similarly, the statistical analysis conducted on geographies consisting of 74,312,807 people shows a substantial positive correlation between the proportion of Immigrants from North Macedonia and labor force participation rate among population between the ages 30 and 34 in the United States with a correlation coefficient (R) of 0.549 and weighted average of 85.9%, a difference of 1.2%.
In Labor Force | Age 30-34 Correlation Summary
| Measurement | Colombian | Immigrants from North Macedonia |
| Minimum | 61.2% | 76.8% |
| Maximum | 100.0% | 100.0% |
| Range | 38.8% | 23.2% |
| Mean | 85.6% | 87.8% |
| Median | 85.1% | 86.9% |
| Interquartile 25% (IQ1) | 83.5% | 83.9% |
| Interquartile 75% (IQ3) | 87.0% | 91.1% |
| Interquartile Range (IQR) | 3.6% | 7.2% |
| Standard Deviation (Sample) | 5.9% | 6.0% |
| Standard Deviation (Population) | 5.8% | 5.9% |
Similar Demographics by In Labor Force | Age 30-34
Demographics Similar to Colombians by In Labor Force | Age 30-34
In terms of in labor force | age 30-34, the demographic groups most similar to Colombians are Immigrants from Indonesia (84.9%, a difference of 0.030%), Chilean (84.9%, a difference of 0.040%), Uruguayan (84.9%, a difference of 0.040%), Palestinian (84.9%, a difference of 0.050%), and Immigrants from Vietnam (85.0%, a difference of 0.060%).
| Demographics | Rating | Rank | In Labor Force | Age 30-34 |
| Jordanians | 88.6 /100 | #136 | Excellent 85.0% |
| South Africans | 88.0 /100 | #137 | Excellent 85.0% |
| Sri Lankans | 87.8 /100 | #138 | Excellent 85.0% |
| Bhutanese | 87.5 /100 | #139 | Excellent 85.0% |
| Immigrants | Vietnam | 86.5 /100 | #140 | Excellent 85.0% |
| Chileans | 85.3 /100 | #141 | Excellent 84.9% |
| Immigrants | Indonesia | 84.3 /100 | #142 | Excellent 84.9% |
| Colombians | 82.2 /100 | #143 | Excellent 84.9% |
| Uruguayans | 78.5 /100 | #144 | Good 84.9% |
| Palestinians | 77.7 /100 | #145 | Good 84.9% |
| Immigrants | Saudi Arabia | 76.6 /100 | #146 | Good 84.9% |
| Immigrants | Colombia | 76.3 /100 | #147 | Good 84.9% |
| Immigrants | Pakistan | 76.2 /100 | #148 | Good 84.9% |
| Immigrants | Ukraine | 75.1 /100 | #149 | Good 84.8% |
| Germans | 75.1 /100 | #150 | Good 84.8% |
Demographics Similar to Immigrants from North Macedonia by In Labor Force | Age 30-34
In terms of in labor force | age 30-34, the demographic groups most similar to Immigrants from North Macedonia are Immigrants from Eritrea (85.9%, a difference of 0.010%), Immigrants from Eastern Africa (85.9%, a difference of 0.010%), Bermudan (85.9%, a difference of 0.020%), Estonian (85.9%, a difference of 0.020%), and Immigrants from Liberia (85.9%, a difference of 0.030%).
| Demographics | Rating | Rank | In Labor Force | Age 30-34 |
| Immigrants | Sierra Leone | 100.0 /100 | #18 | Exceptional 86.0% |
| Sierra Leoneans | 100.0 /100 | #19 | Exceptional 86.0% |
| Bulgarians | 100.0 /100 | #20 | Exceptional 86.0% |
| Immigrants | Bulgaria | 100.0 /100 | #21 | Exceptional 86.0% |
| Bermudans | 100.0 /100 | #22 | Exceptional 85.9% |
| Estonians | 100.0 /100 | #23 | Exceptional 85.9% |
| Immigrants | Eritrea | 100.0 /100 | #24 | Exceptional 85.9% |
| Immigrants | North Macedonia | 100.0 /100 | #25 | Exceptional 85.9% |
| Immigrants | Eastern Africa | 100.0 /100 | #26 | Exceptional 85.9% |
| Immigrants | Liberia | 100.0 /100 | #27 | Exceptional 85.9% |
| Immigrants | Latvia | 100.0 /100 | #28 | Exceptional 85.9% |
| Tsimshian | 100.0 /100 | #29 | Exceptional 85.8% |
| Immigrants | Hong Kong | 100.0 /100 | #30 | Exceptional 85.8% |
| Paraguayans | 99.9 /100 | #31 | Exceptional 85.8% |
| Cypriots | 99.9 /100 | #32 | Exceptional 85.8% |