Menominee vs Immigrants from North Macedonia In Labor Force | Age 30-34
COMPARE
Menominee
Immigrants from North Macedonia
In Labor Force | Age 30-34
In Labor Force | Age 30-34 Comparison
Menominee
Immigrants from North Macedonia
82.2%
IN LABOR FORCE | AGE 30-34
0.0/ 100
METRIC RATING
307th/ 347
METRIC RANK
85.9%
IN LABOR FORCE | AGE 30-34
100.0/ 100
METRIC RATING
25th/ 347
METRIC RANK
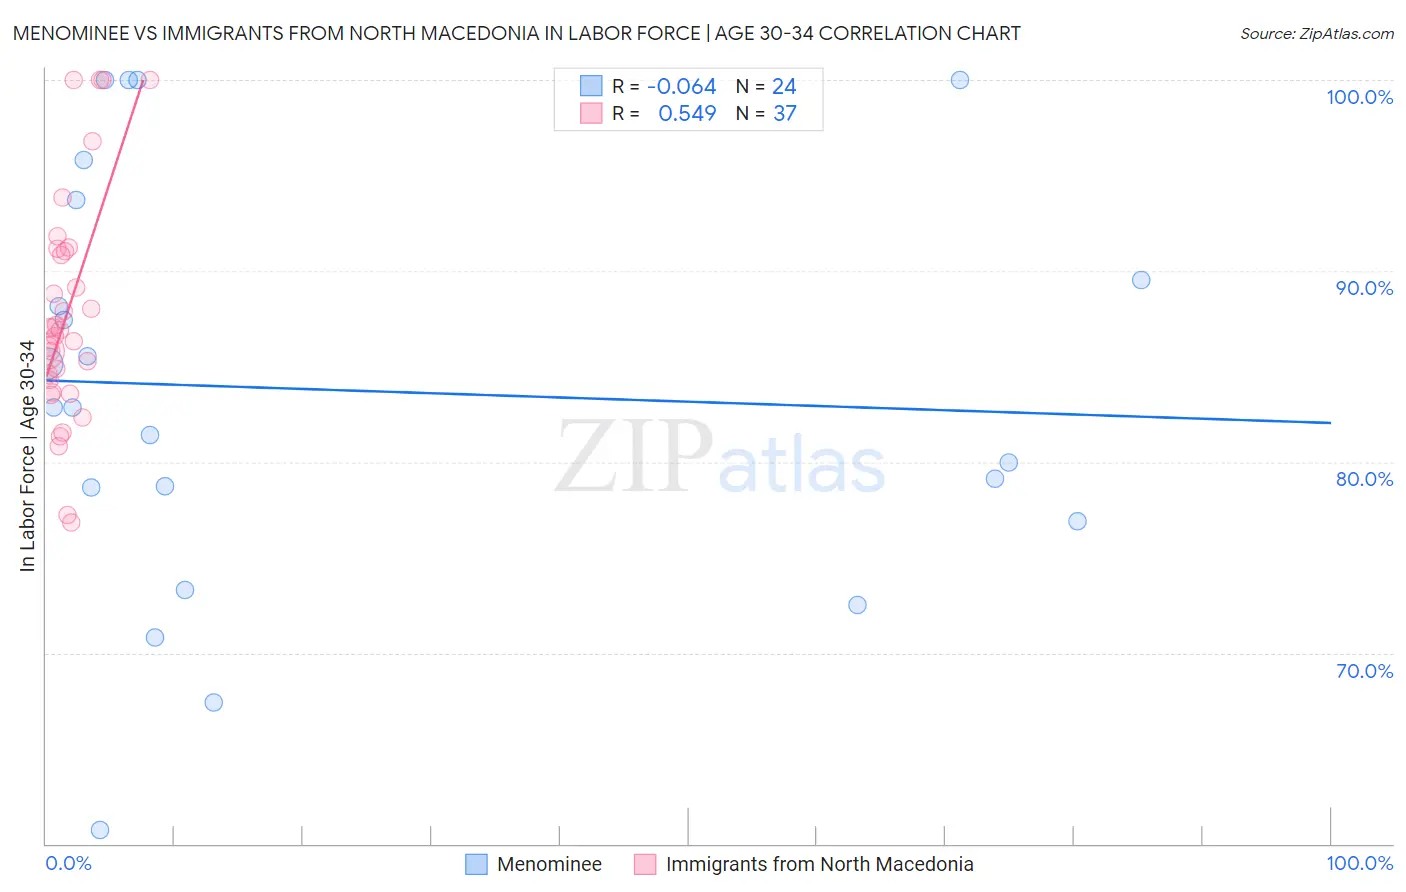
Menominee vs Immigrants from North Macedonia In Labor Force | Age 30-34 Correlation Chart
The statistical analysis conducted on geographies consisting of 45,774,457 people shows a slight negative correlation between the proportion of Menominee and labor force participation rate among population between the ages 30 and 34 in the United States with a correlation coefficient (R) of -0.064 and weighted average of 82.2%. Similarly, the statistical analysis conducted on geographies consisting of 74,312,807 people shows a substantial positive correlation between the proportion of Immigrants from North Macedonia and labor force participation rate among population between the ages 30 and 34 in the United States with a correlation coefficient (R) of 0.549 and weighted average of 85.9%, a difference of 4.5%.
In Labor Force | Age 30-34 Correlation Summary
| Measurement | Menominee | Immigrants from North Macedonia |
| Minimum | 60.7% | 76.8% |
| Maximum | 100.0% | 100.0% |
| Range | 39.3% | 23.2% |
| Mean | 83.8% | 87.8% |
| Median | 82.9% | 86.9% |
| Interquartile 25% (IQ1) | 77.8% | 83.9% |
| Interquartile 75% (IQ3) | 91.6% | 91.1% |
| Interquartile Range (IQR) | 13.8% | 7.2% |
| Standard Deviation (Sample) | 10.9% | 6.0% |
| Standard Deviation (Population) | 10.6% | 5.9% |
Similar Demographics by In Labor Force | Age 30-34
Demographics Similar to Menominee by In Labor Force | Age 30-34
In terms of in labor force | age 30-34, the demographic groups most similar to Menominee are Spanish American Indian (82.2%, a difference of 0.060%), Osage (82.3%, a difference of 0.070%), Puget Sound Salish (82.1%, a difference of 0.10%), Tlingit-Haida (82.3%, a difference of 0.15%), and Immigrants from Micronesia (82.4%, a difference of 0.23%).
| Demographics | Rating | Rank | In Labor Force | Age 30-34 |
| Hmong | 0.0 /100 | #300 | Tragic 82.4% |
| Hispanics or Latinos | 0.0 /100 | #301 | Tragic 82.4% |
| Ottawa | 0.0 /100 | #302 | Tragic 82.4% |
| Immigrants | Micronesia | 0.0 /100 | #303 | Tragic 82.4% |
| Tlingit-Haida | 0.0 /100 | #304 | Tragic 82.3% |
| Osage | 0.0 /100 | #305 | Tragic 82.3% |
| Spanish American Indians | 0.0 /100 | #306 | Tragic 82.2% |
| Menominee | 0.0 /100 | #307 | Tragic 82.2% |
| Puget Sound Salish | 0.0 /100 | #308 | Tragic 82.1% |
| Immigrants | Mexico | 0.0 /100 | #309 | Tragic 82.0% |
| Cajuns | 0.0 /100 | #310 | Tragic 82.0% |
| Chickasaw | 0.0 /100 | #311 | Tragic 81.9% |
| Mexicans | 0.0 /100 | #312 | Tragic 81.9% |
| Iroquois | 0.0 /100 | #313 | Tragic 81.9% |
| Alaskan Athabascans | 0.0 /100 | #314 | Tragic 81.7% |
Demographics Similar to Immigrants from North Macedonia by In Labor Force | Age 30-34
In terms of in labor force | age 30-34, the demographic groups most similar to Immigrants from North Macedonia are Immigrants from Eritrea (85.9%, a difference of 0.010%), Immigrants from Eastern Africa (85.9%, a difference of 0.010%), Bermudan (85.9%, a difference of 0.020%), Estonian (85.9%, a difference of 0.020%), and Immigrants from Liberia (85.9%, a difference of 0.030%).
| Demographics | Rating | Rank | In Labor Force | Age 30-34 |
| Immigrants | Sierra Leone | 100.0 /100 | #18 | Exceptional 86.0% |
| Sierra Leoneans | 100.0 /100 | #19 | Exceptional 86.0% |
| Bulgarians | 100.0 /100 | #20 | Exceptional 86.0% |
| Immigrants | Bulgaria | 100.0 /100 | #21 | Exceptional 86.0% |
| Bermudans | 100.0 /100 | #22 | Exceptional 85.9% |
| Estonians | 100.0 /100 | #23 | Exceptional 85.9% |
| Immigrants | Eritrea | 100.0 /100 | #24 | Exceptional 85.9% |
| Immigrants | North Macedonia | 100.0 /100 | #25 | Exceptional 85.9% |
| Immigrants | Eastern Africa | 100.0 /100 | #26 | Exceptional 85.9% |
| Immigrants | Liberia | 100.0 /100 | #27 | Exceptional 85.9% |
| Immigrants | Latvia | 100.0 /100 | #28 | Exceptional 85.9% |
| Tsimshian | 100.0 /100 | #29 | Exceptional 85.8% |
| Immigrants | Hong Kong | 100.0 /100 | #30 | Exceptional 85.8% |
| Paraguayans | 99.9 /100 | #31 | Exceptional 85.8% |
| Cypriots | 99.9 /100 | #32 | Exceptional 85.8% |