French American Indian vs Immigrants from Fiji In Labor Force | Age 30-34
COMPARE
French American Indian
Immigrants from Fiji
In Labor Force | Age 30-34
In Labor Force | Age 30-34 Comparison
French American Indians
Immigrants from Fiji
84.1%
IN LABOR FORCE | AGE 30-34
1.7/ 100
METRIC RATING
235th/ 347
METRIC RANK
83.4%
IN LABOR FORCE | AGE 30-34
0.0/ 100
METRIC RATING
279th/ 347
METRIC RANK
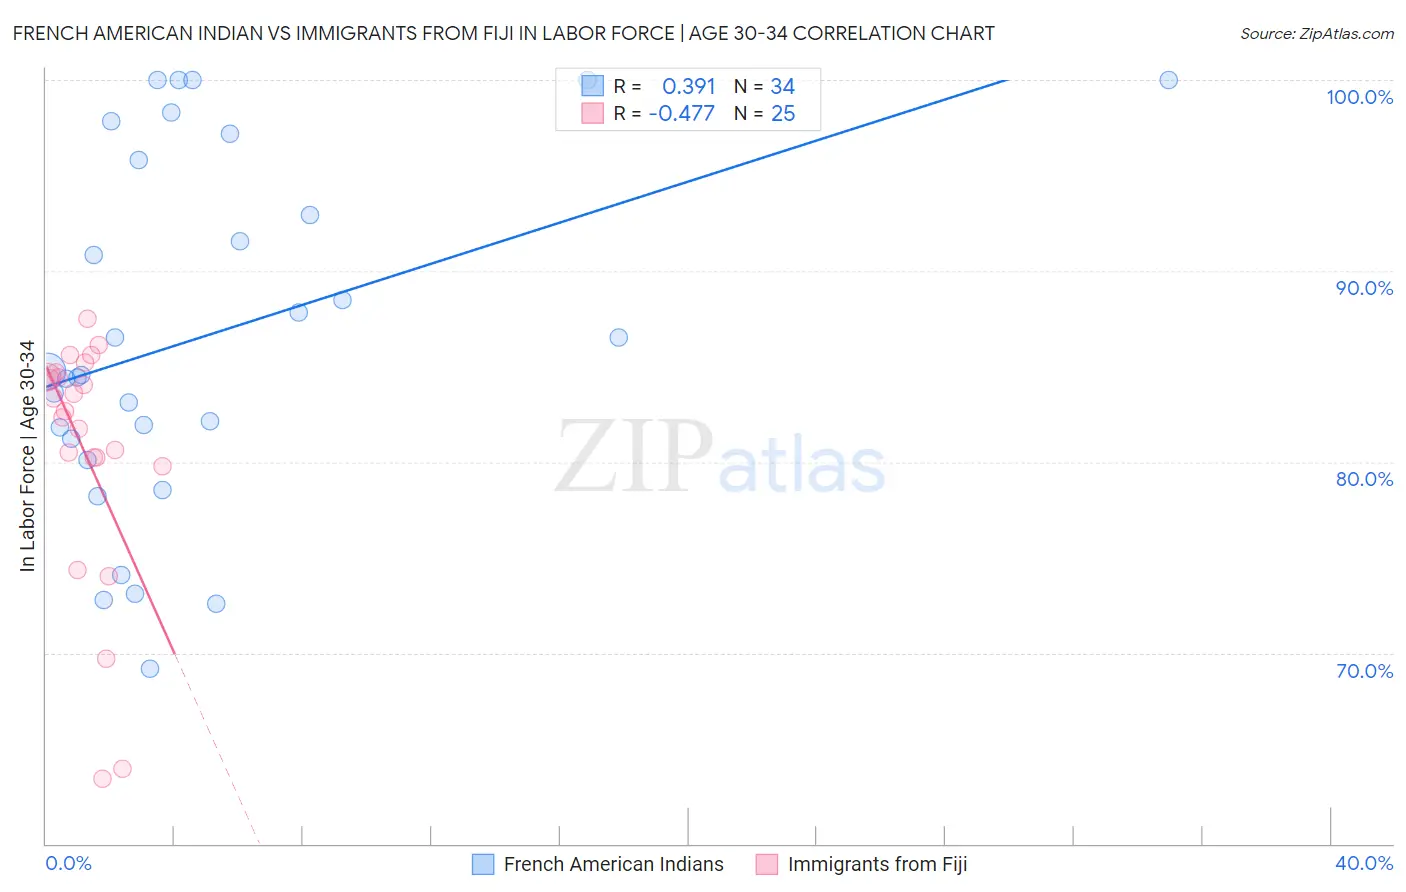
French American Indian vs Immigrants from Fiji In Labor Force | Age 30-34 Correlation Chart
The statistical analysis conducted on geographies consisting of 131,961,929 people shows a mild positive correlation between the proportion of French American Indians and labor force participation rate among population between the ages 30 and 34 in the United States with a correlation coefficient (R) of 0.391 and weighted average of 84.1%. Similarly, the statistical analysis conducted on geographies consisting of 93,755,407 people shows a moderate negative correlation between the proportion of Immigrants from Fiji and labor force participation rate among population between the ages 30 and 34 in the United States with a correlation coefficient (R) of -0.477 and weighted average of 83.4%, a difference of 0.81%.
In Labor Force | Age 30-34 Correlation Summary
| Measurement | French American Indian | Immigrants from Fiji |
| Minimum | 69.1% | 63.4% |
| Maximum | 100.0% | 87.5% |
| Range | 30.9% | 24.1% |
| Mean | 86.6% | 80.5% |
| Median | 84.7% | 82.7% |
| Interquartile 25% (IQ1) | 81.2% | 80.0% |
| Interquartile 75% (IQ3) | 95.8% | 84.6% |
| Interquartile Range (IQR) | 14.6% | 4.6% |
| Standard Deviation (Sample) | 9.2% | 6.5% |
| Standard Deviation (Population) | 9.1% | 6.4% |
Similar Demographics by In Labor Force | Age 30-34
Demographics Similar to French American Indians by In Labor Force | Age 30-34
In terms of in labor force | age 30-34, the demographic groups most similar to French American Indians are Haitian (84.1%, a difference of 0.010%), West Indian (84.1%, a difference of 0.020%), U.S. Virgin Islander (84.1%, a difference of 0.020%), Immigrants (84.1%, a difference of 0.030%), and Celtic (84.1%, a difference of 0.030%).
| Demographics | Rating | Rank | In Labor Force | Age 30-34 |
| Immigrants | Haiti | 2.8 /100 | #228 | Tragic 84.2% |
| Welsh | 2.7 /100 | #229 | Tragic 84.2% |
| Immigrants | Bahamas | 2.6 /100 | #230 | Tragic 84.1% |
| Malaysians | 2.2 /100 | #231 | Tragic 84.1% |
| Immigrants | Immigrants | 2.0 /100 | #232 | Tragic 84.1% |
| West Indians | 1.9 /100 | #233 | Tragic 84.1% |
| Haitians | 1.8 /100 | #234 | Tragic 84.1% |
| French American Indians | 1.7 /100 | #235 | Tragic 84.1% |
| U.S. Virgin Islanders | 1.5 /100 | #236 | Tragic 84.1% |
| Celtics | 1.4 /100 | #237 | Tragic 84.1% |
| Immigrants | Barbados | 1.4 /100 | #238 | Tragic 84.0% |
| English | 1.4 /100 | #239 | Tragic 84.0% |
| Venezuelans | 1.3 /100 | #240 | Tragic 84.0% |
| Immigrants | Portugal | 1.2 /100 | #241 | Tragic 84.0% |
| Immigrants | Oceania | 1.1 /100 | #242 | Tragic 84.0% |
Demographics Similar to Immigrants from Fiji by In Labor Force | Age 30-34
In terms of in labor force | age 30-34, the demographic groups most similar to Immigrants from Fiji are Fijian (83.4%, a difference of 0.010%), African (83.4%, a difference of 0.030%), Delaware (83.5%, a difference of 0.070%), Tongan (83.5%, a difference of 0.080%), and Immigrants from Grenada (83.5%, a difference of 0.090%).
| Demographics | Rating | Rank | In Labor Force | Age 30-34 |
| Immigrants | Nonimmigrants | 0.0 /100 | #272 | Tragic 83.5% |
| Guamanians/Chamorros | 0.0 /100 | #273 | Tragic 83.5% |
| Belizeans | 0.0 /100 | #274 | Tragic 83.5% |
| Immigrants | Grenada | 0.0 /100 | #275 | Tragic 83.5% |
| Tongans | 0.0 /100 | #276 | Tragic 83.5% |
| Delaware | 0.0 /100 | #277 | Tragic 83.5% |
| Fijians | 0.0 /100 | #278 | Tragic 83.4% |
| Immigrants | Fiji | 0.0 /100 | #279 | Tragic 83.4% |
| Africans | 0.0 /100 | #280 | Tragic 83.4% |
| Samoans | 0.0 /100 | #281 | Tragic 83.3% |
| Mexican American Indians | 0.0 /100 | #282 | Tragic 83.2% |
| Assyrians/Chaldeans/Syriacs | 0.0 /100 | #283 | Tragic 83.2% |
| Immigrants | Belize | 0.0 /100 | #284 | Tragic 83.2% |
| Cree | 0.0 /100 | #285 | Tragic 83.2% |
| Immigrants | Latin America | 0.0 /100 | #286 | Tragic 83.1% |