Immigrants from Kuwait vs Alaska Native Unemployment Among Ages 30 to 34 years
COMPARE
Immigrants from Kuwait
Alaska Native
Unemployment Among Ages 30 to 34 years
Unemployment Among Ages 30 to 34 years Comparison
Immigrants from Kuwait
Alaska Natives
5.0%
UNEMPLOYMENT AMONG AGES 30 TO 34 YEARS
99.5/ 100
METRIC RATING
26th/ 347
METRIC RANK
8.5%
UNEMPLOYMENT AMONG AGES 30 TO 34 YEARS
0.0/ 100
METRIC RATING
334th/ 347
METRIC RANK
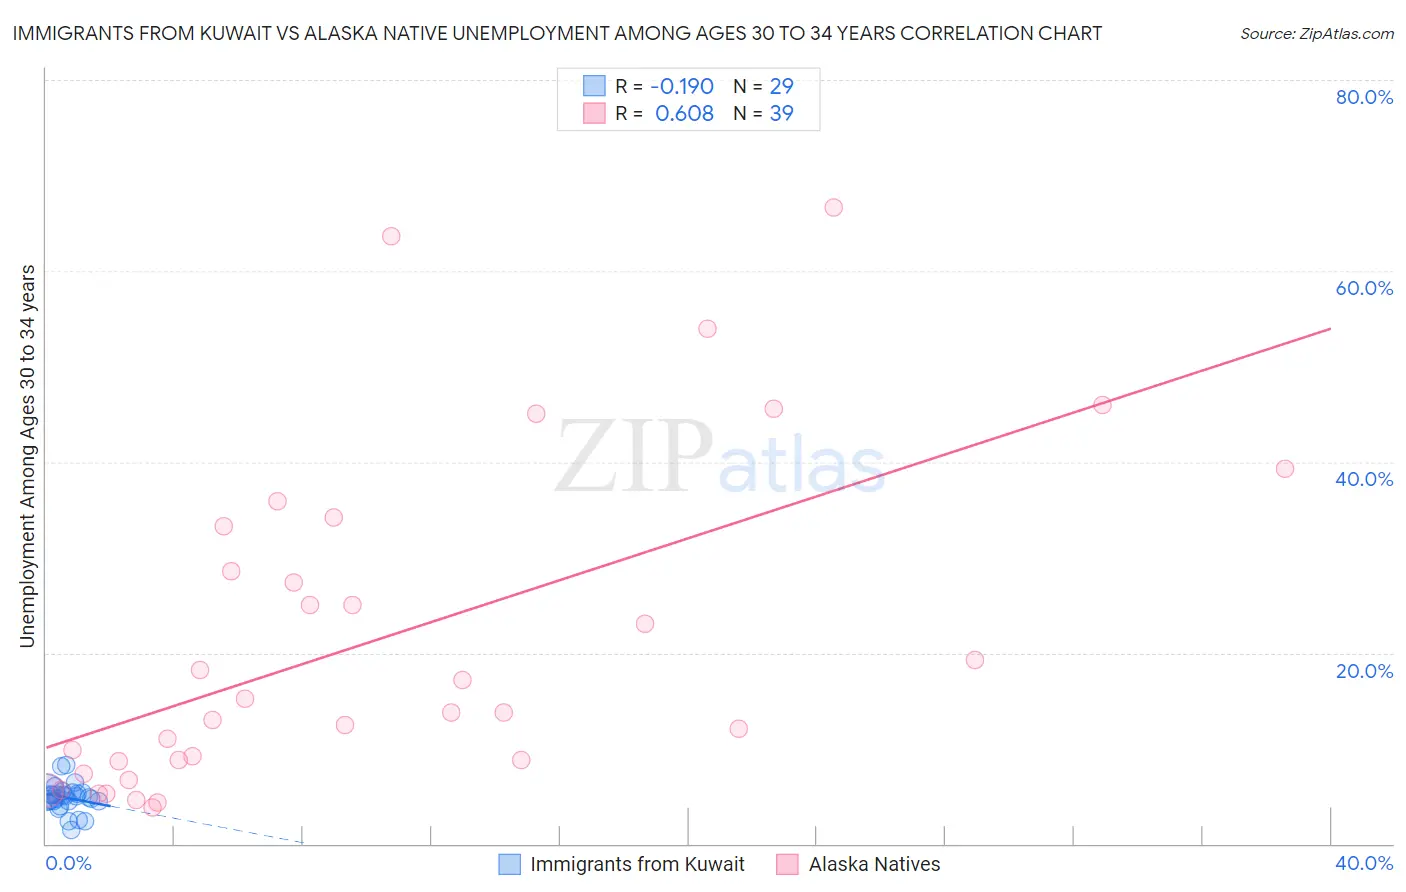
Immigrants from Kuwait vs Alaska Native Unemployment Among Ages 30 to 34 years Correlation Chart
The statistical analysis conducted on geographies consisting of 134,713,450 people shows a poor negative correlation between the proportion of Immigrants from Kuwait and unemployment rate among population between the ages 30 and 34 in the United States with a correlation coefficient (R) of -0.190 and weighted average of 5.0%. Similarly, the statistical analysis conducted on geographies consisting of 75,749,342 people shows a significant positive correlation between the proportion of Alaska Natives and unemployment rate among population between the ages 30 and 34 in the United States with a correlation coefficient (R) of 0.608 and weighted average of 8.5%, a difference of 71.1%.
Unemployment Among Ages 30 to 34 years Correlation Summary
| Measurement | Immigrants from Kuwait | Alaska Native |
| Minimum | 1.4% | 3.8% |
| Maximum | 8.3% | 66.7% |
| Range | 6.9% | 62.9% |
| Mean | 4.8% | 21.3% |
| Median | 5.0% | 13.8% |
| Interquartile 25% (IQ1) | 4.5% | 8.7% |
| Interquartile 75% (IQ3) | 5.4% | 33.3% |
| Interquartile Range (IQR) | 0.86% | 24.6% |
| Standard Deviation (Sample) | 1.5% | 17.2% |
| Standard Deviation (Population) | 1.4% | 16.9% |
Similar Demographics by Unemployment Among Ages 30 to 34 years
Demographics Similar to Immigrants from Kuwait by Unemployment Among Ages 30 to 34 years
In terms of unemployment among ages 30 to 34 years, the demographic groups most similar to Immigrants from Kuwait are Danish (5.0%, a difference of 0.11%), Immigrants from Singapore (5.0%, a difference of 0.17%), Immigrants from Cuba (5.0%, a difference of 0.35%), German Russian (5.0%, a difference of 0.37%), and Norwegian (5.0%, a difference of 0.39%).
| Demographics | Rating | Rank | Unemployment Among Ages 30 to 34 years |
| Immigrants | Sudan | 99.8 /100 | #19 | Exceptional 4.9% |
| Immigrants | Taiwan | 99.8 /100 | #20 | Exceptional 4.9% |
| Ethiopians | 99.8 /100 | #21 | Exceptional 4.9% |
| Immigrants | South Central Asia | 99.8 /100 | #22 | Exceptional 4.9% |
| Hmong | 99.8 /100 | #23 | Exceptional 4.9% |
| Ugandans | 99.7 /100 | #24 | Exceptional 4.9% |
| Immigrants | Singapore | 99.5 /100 | #25 | Exceptional 5.0% |
| Immigrants | Kuwait | 99.5 /100 | #26 | Exceptional 5.0% |
| Danes | 99.5 /100 | #27 | Exceptional 5.0% |
| Immigrants | Cuba | 99.4 /100 | #28 | Exceptional 5.0% |
| German Russians | 99.4 /100 | #29 | Exceptional 5.0% |
| Norwegians | 99.4 /100 | #30 | Exceptional 5.0% |
| Somalis | 99.3 /100 | #31 | Exceptional 5.0% |
| Immigrants | Zaire | 99.3 /100 | #32 | Exceptional 5.0% |
| Immigrants | Saudi Arabia | 99.3 /100 | #33 | Exceptional 5.0% |
Demographics Similar to Alaska Natives by Unemployment Among Ages 30 to 34 years
In terms of unemployment among ages 30 to 34 years, the demographic groups most similar to Alaska Natives are Pueblo (8.3%, a difference of 2.7%), Native/Alaskan (8.2%, a difference of 3.1%), Puerto Rican (8.9%, a difference of 4.5%), Sioux (8.0%, a difference of 5.8%), and Colville (9.0%, a difference of 6.5%).
| Demographics | Rating | Rank | Unemployment Among Ages 30 to 34 years |
| Immigrants | Dominican Republic | 0.0 /100 | #327 | Tragic 7.7% |
| Chippewa | 0.0 /100 | #328 | Tragic 7.8% |
| Cheyenne | 0.0 /100 | #329 | Tragic 7.8% |
| Shoshone | 0.0 /100 | #330 | Tragic 7.9% |
| Sioux | 0.0 /100 | #331 | Tragic 8.0% |
| Natives/Alaskans | 0.0 /100 | #332 | Tragic 8.2% |
| Pueblo | 0.0 /100 | #333 | Tragic 8.3% |
| Alaska Natives | 0.0 /100 | #334 | Tragic 8.5% |
| Puerto Ricans | 0.0 /100 | #335 | Tragic 8.9% |
| Colville | 0.0 /100 | #336 | Tragic 9.0% |
| Pima | 0.0 /100 | #337 | Tragic 9.6% |
| Yakama | 0.0 /100 | #338 | Tragic 9.8% |
| Tohono O'odham | 0.0 /100 | #339 | Tragic 9.8% |
| Crow | 0.0 /100 | #340 | Tragic 10.3% |
| Navajo | 0.0 /100 | #341 | Tragic 10.6% |