Immigrants from Kuwait vs Alaska Native Vision Disability
COMPARE
Immigrants from Kuwait
Alaska Native
Vision Disability
Vision Disability Comparison
Immigrants from Kuwait
Alaska Natives
2.0%
VISION DISABILITY
99.8/ 100
METRIC RATING
38th/ 347
METRIC RANK
2.7%
VISION DISABILITY
0.0/ 100
METRIC RATING
318th/ 347
METRIC RANK
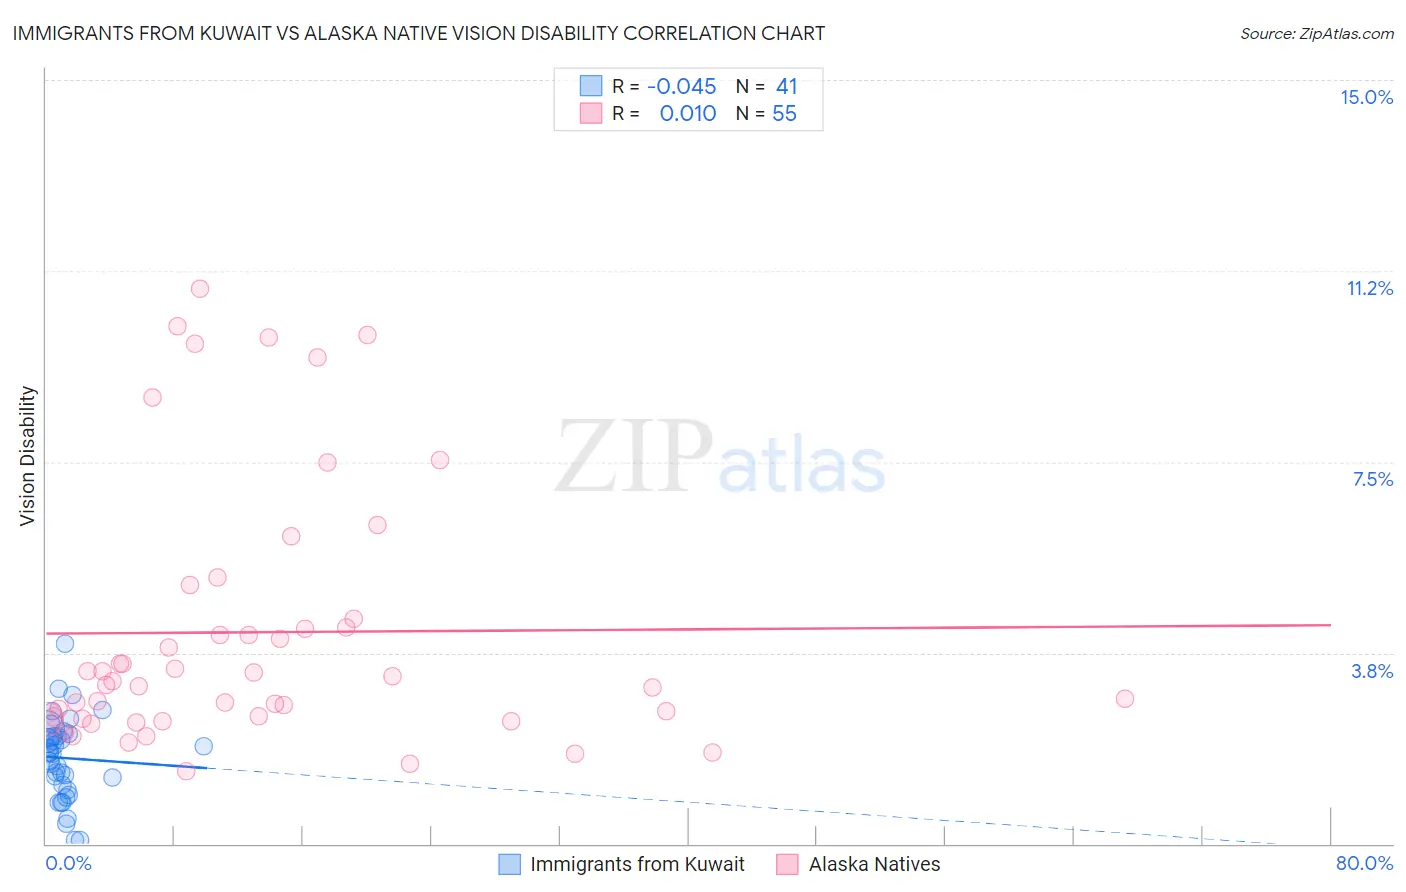
Immigrants from Kuwait vs Alaska Native Vision Disability Correlation Chart
The statistical analysis conducted on geographies consisting of 136,909,771 people shows no correlation between the proportion of Immigrants from Kuwait and percentage of population with vision disability in the United States with a correlation coefficient (R) of -0.045 and weighted average of 2.0%. Similarly, the statistical analysis conducted on geographies consisting of 76,749,466 people shows no correlation between the proportion of Alaska Natives and percentage of population with vision disability in the United States with a correlation coefficient (R) of 0.010 and weighted average of 2.7%, a difference of 39.2%.
Vision Disability Correlation Summary
| Measurement | Immigrants from Kuwait | Alaska Native |
| Minimum | 0.068% | 1.4% |
| Maximum | 3.9% | 10.9% |
| Range | 3.9% | 9.5% |
| Mean | 1.7% | 4.2% |
| Median | 1.8% | 3.2% |
| Interquartile 25% (IQ1) | 1.1% | 2.5% |
| Interquartile 75% (IQ3) | 2.1% | 4.4% |
| Interquartile Range (IQR) | 1.0% | 1.9% |
| Standard Deviation (Sample) | 0.81% | 2.6% |
| Standard Deviation (Population) | 0.80% | 2.5% |
Similar Demographics by Vision Disability
Demographics Similar to Immigrants from Kuwait by Vision Disability
In terms of vision disability, the demographic groups most similar to Immigrants from Kuwait are Bhutanese (2.0%, a difference of 0.040%), Zimbabwean (2.0%, a difference of 0.060%), Immigrants from Ireland (2.0%, a difference of 0.26%), Cypriot (2.0%, a difference of 0.28%), and Cambodian (2.0%, a difference of 0.29%).
| Demographics | Rating | Rank | Vision Disability |
| Mongolians | 99.9 /100 | #31 | Exceptional 1.9% |
| Luxembourgers | 99.9 /100 | #32 | Exceptional 1.9% |
| Immigrants | Egypt | 99.9 /100 | #33 | Exceptional 1.9% |
| Immigrants | Turkey | 99.8 /100 | #34 | Exceptional 1.9% |
| Immigrants | Australia | 99.8 /100 | #35 | Exceptional 1.9% |
| Cambodians | 99.8 /100 | #36 | Exceptional 2.0% |
| Bhutanese | 99.8 /100 | #37 | Exceptional 2.0% |
| Immigrants | Kuwait | 99.8 /100 | #38 | Exceptional 2.0% |
| Zimbabweans | 99.7 /100 | #39 | Exceptional 2.0% |
| Immigrants | Ireland | 99.7 /100 | #40 | Exceptional 2.0% |
| Cypriots | 99.7 /100 | #41 | Exceptional 2.0% |
| Immigrants | Ethiopia | 99.7 /100 | #42 | Exceptional 2.0% |
| Eastern Europeans | 99.7 /100 | #43 | Exceptional 2.0% |
| Immigrants | Indonesia | 99.7 /100 | #44 | Exceptional 2.0% |
| Ethiopians | 99.7 /100 | #45 | Exceptional 2.0% |
Demographics Similar to Alaska Natives by Vision Disability
In terms of vision disability, the demographic groups most similar to Alaska Natives are Yup'ik (2.7%, a difference of 1.1%), Shoshone (2.7%, a difference of 1.3%), Tohono O'odham (2.8%, a difference of 1.4%), Osage (2.7%, a difference of 1.8%), and Black/African American (2.8%, a difference of 2.1%).
| Demographics | Rating | Rank | Vision Disability |
| Dominicans | 0.0 /100 | #311 | Tragic 2.6% |
| Americans | 0.0 /100 | #312 | Tragic 2.6% |
| Potawatomi | 0.0 /100 | #313 | Tragic 2.6% |
| Inupiat | 0.0 /100 | #314 | Tragic 2.7% |
| Osage | 0.0 /100 | #315 | Tragic 2.7% |
| Shoshone | 0.0 /100 | #316 | Tragic 2.7% |
| Yup'ik | 0.0 /100 | #317 | Tragic 2.7% |
| Alaska Natives | 0.0 /100 | #318 | Tragic 2.7% |
| Tohono O'odham | 0.0 /100 | #319 | Tragic 2.8% |
| Blacks/African Americans | 0.0 /100 | #320 | Tragic 2.8% |
| Comanche | 0.0 /100 | #321 | Tragic 2.8% |
| Paiute | 0.0 /100 | #322 | Tragic 2.9% |
| Tlingit-Haida | 0.0 /100 | #323 | Tragic 2.9% |
| Hopi | 0.0 /100 | #324 | Tragic 2.9% |
| Cherokee | 0.0 /100 | #325 | Tragic 2.9% |