Immigrants from Korea vs Bulgarian In Labor Force | Age 20-64
COMPARE
Immigrants from Korea
Bulgarian
In Labor Force | Age 20-64
In Labor Force | Age 20-64 Comparison
Immigrants from Korea
Bulgarians
80.3%
IN LABOR FORCE | AGE 20-64
98.8/ 100
METRIC RATING
63rd/ 347
METRIC RANK
81.1%
IN LABOR FORCE | AGE 20-64
100.0/ 100
METRIC RATING
15th/ 347
METRIC RANK
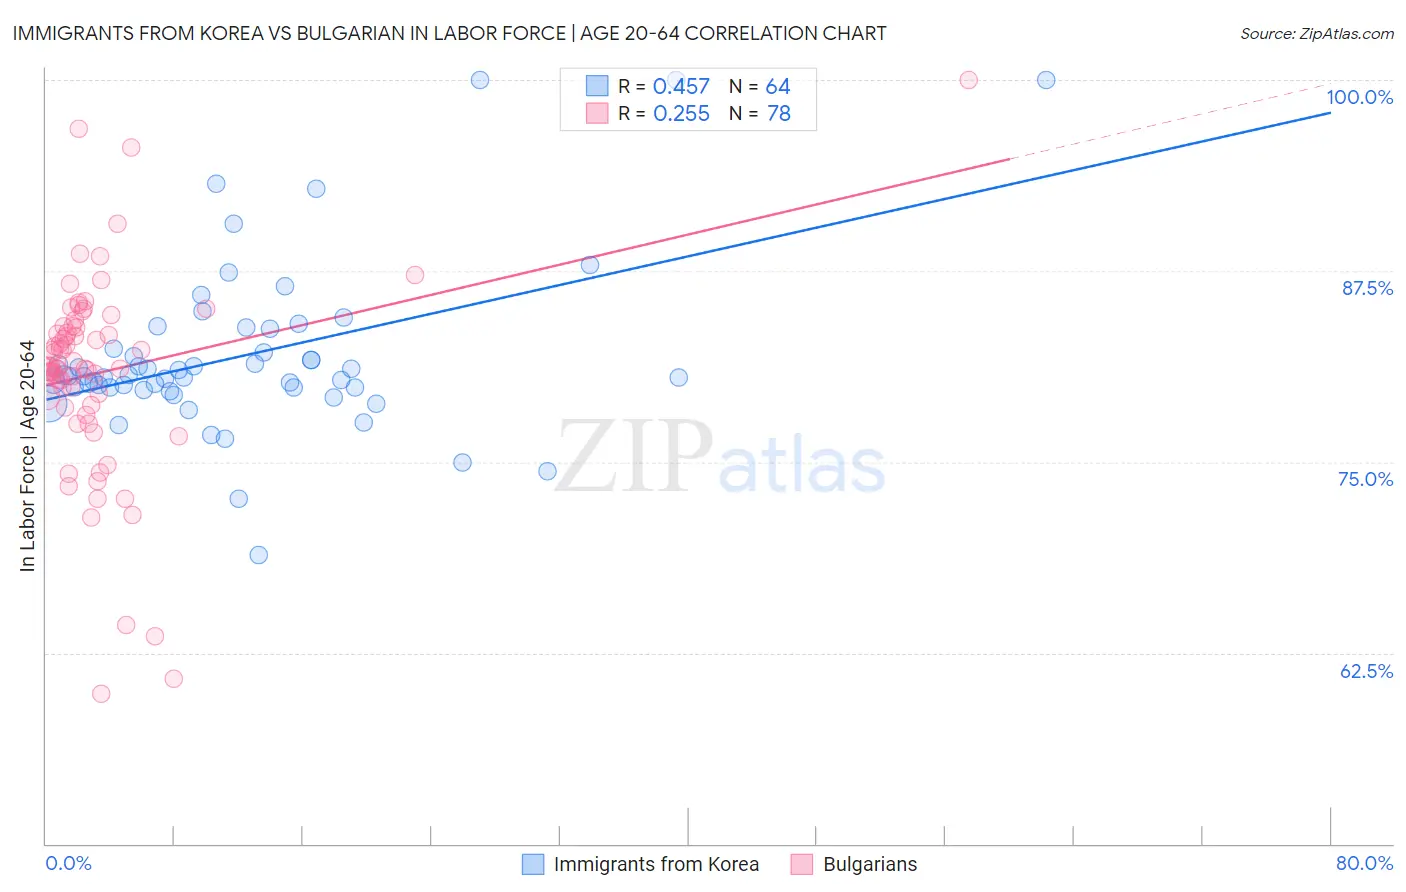
Immigrants from Korea vs Bulgarian In Labor Force | Age 20-64 Correlation Chart
The statistical analysis conducted on geographies consisting of 416,355,366 people shows a moderate positive correlation between the proportion of Immigrants from Korea and labor force participation rate among population between the ages 20 and 64 in the United States with a correlation coefficient (R) of 0.457 and weighted average of 80.3%. Similarly, the statistical analysis conducted on geographies consisting of 205,633,512 people shows a weak positive correlation between the proportion of Bulgarians and labor force participation rate among population between the ages 20 and 64 in the United States with a correlation coefficient (R) of 0.255 and weighted average of 81.1%, a difference of 0.99%.
In Labor Force | Age 20-64 Correlation Summary
| Measurement | Immigrants from Korea | Bulgarian |
| Minimum | 68.9% | 59.8% |
| Maximum | 100.0% | 100.0% |
| Range | 31.1% | 40.2% |
| Mean | 82.0% | 80.8% |
| Median | 80.6% | 81.2% |
| Interquartile 25% (IQ1) | 79.9% | 78.8% |
| Interquartile 75% (IQ3) | 83.1% | 83.8% |
| Interquartile Range (IQR) | 3.2% | 5.1% |
| Standard Deviation (Sample) | 5.6% | 6.7% |
| Standard Deviation (Population) | 5.6% | 6.6% |
Similar Demographics by In Labor Force | Age 20-64
Demographics Similar to Immigrants from Korea by In Labor Force | Age 20-64
In terms of in labor force | age 20-64, the demographic groups most similar to Immigrants from Korea are Immigrants from Albania (80.3%, a difference of 0.0%), Tongan (80.3%, a difference of 0.010%), Burmese (80.3%, a difference of 0.010%), Carpatho Rusyn (80.3%, a difference of 0.010%), and Lithuanian (80.2%, a difference of 0.010%).
| Demographics | Rating | Rank | In Labor Force | Age 20-64 |
| Immigrants | Northern Africa | 99.0 /100 | #56 | Exceptional 80.3% |
| Afghans | 98.9 /100 | #57 | Exceptional 80.3% |
| Serbians | 98.9 /100 | #58 | Exceptional 80.3% |
| Swedes | 98.9 /100 | #59 | Exceptional 80.3% |
| Tongans | 98.8 /100 | #60 | Exceptional 80.3% |
| Burmese | 98.8 /100 | #61 | Exceptional 80.3% |
| Carpatho Rusyns | 98.8 /100 | #62 | Exceptional 80.3% |
| Immigrants | Korea | 98.8 /100 | #63 | Exceptional 80.3% |
| Immigrants | Albania | 98.7 /100 | #64 | Exceptional 80.3% |
| Lithuanians | 98.7 /100 | #65 | Exceptional 80.2% |
| Macedonians | 98.7 /100 | #66 | Exceptional 80.2% |
| Taiwanese | 98.6 /100 | #67 | Exceptional 80.2% |
| Bhutanese | 98.6 /100 | #68 | Exceptional 80.2% |
| Albanians | 98.6 /100 | #69 | Exceptional 80.2% |
| Immigrants | Turkey | 98.5 /100 | #70 | Exceptional 80.2% |
Demographics Similar to Bulgarians by In Labor Force | Age 20-64
In terms of in labor force | age 20-64, the demographic groups most similar to Bulgarians are Immigrants from Nepal (81.1%, a difference of 0.0%), Cambodian (81.1%, a difference of 0.010%), Norwegian (81.0%, a difference of 0.11%), Immigrants from Bulgaria (81.0%, a difference of 0.12%), and Zimbabwean (81.0%, a difference of 0.12%).
| Demographics | Rating | Rank | In Labor Force | Age 20-64 |
| Immigrants | Somalia | 100.0 /100 | #8 | Exceptional 81.6% |
| Sierra Leoneans | 100.0 /100 | #9 | Exceptional 81.5% |
| Immigrants | Sierra Leone | 100.0 /100 | #10 | Exceptional 81.5% |
| Immigrants | Eastern Africa | 100.0 /100 | #11 | Exceptional 81.3% |
| Immigrants | Eritrea | 100.0 /100 | #12 | Exceptional 81.3% |
| Immigrants | India | 100.0 /100 | #13 | Exceptional 81.3% |
| Cambodians | 100.0 /100 | #14 | Exceptional 81.1% |
| Bulgarians | 100.0 /100 | #15 | Exceptional 81.1% |
| Immigrants | Nepal | 100.0 /100 | #16 | Exceptional 81.1% |
| Norwegians | 100.0 /100 | #17 | Exceptional 81.0% |
| Immigrants | Bulgaria | 100.0 /100 | #18 | Exceptional 81.0% |
| Zimbabweans | 100.0 /100 | #19 | Exceptional 81.0% |
| Thais | 100.0 /100 | #20 | Exceptional 80.9% |
| Liberians | 100.0 /100 | #21 | Exceptional 80.9% |
| Sudanese | 100.0 /100 | #22 | Exceptional 80.8% |