Immigrants from Kazakhstan vs Yakama In Labor Force | Age 35-44
COMPARE
Immigrants from Kazakhstan
Yakama
In Labor Force | Age 35-44
In Labor Force | Age 35-44 Comparison
Immigrants from Kazakhstan
Yakama
84.4%
IN LABOR FORCE | AGE 35-44
60.4/ 100
METRIC RATING
160th/ 347
METRIC RANK
79.0%
IN LABOR FORCE | AGE 35-44
0.0/ 100
METRIC RATING
334th/ 347
METRIC RANK
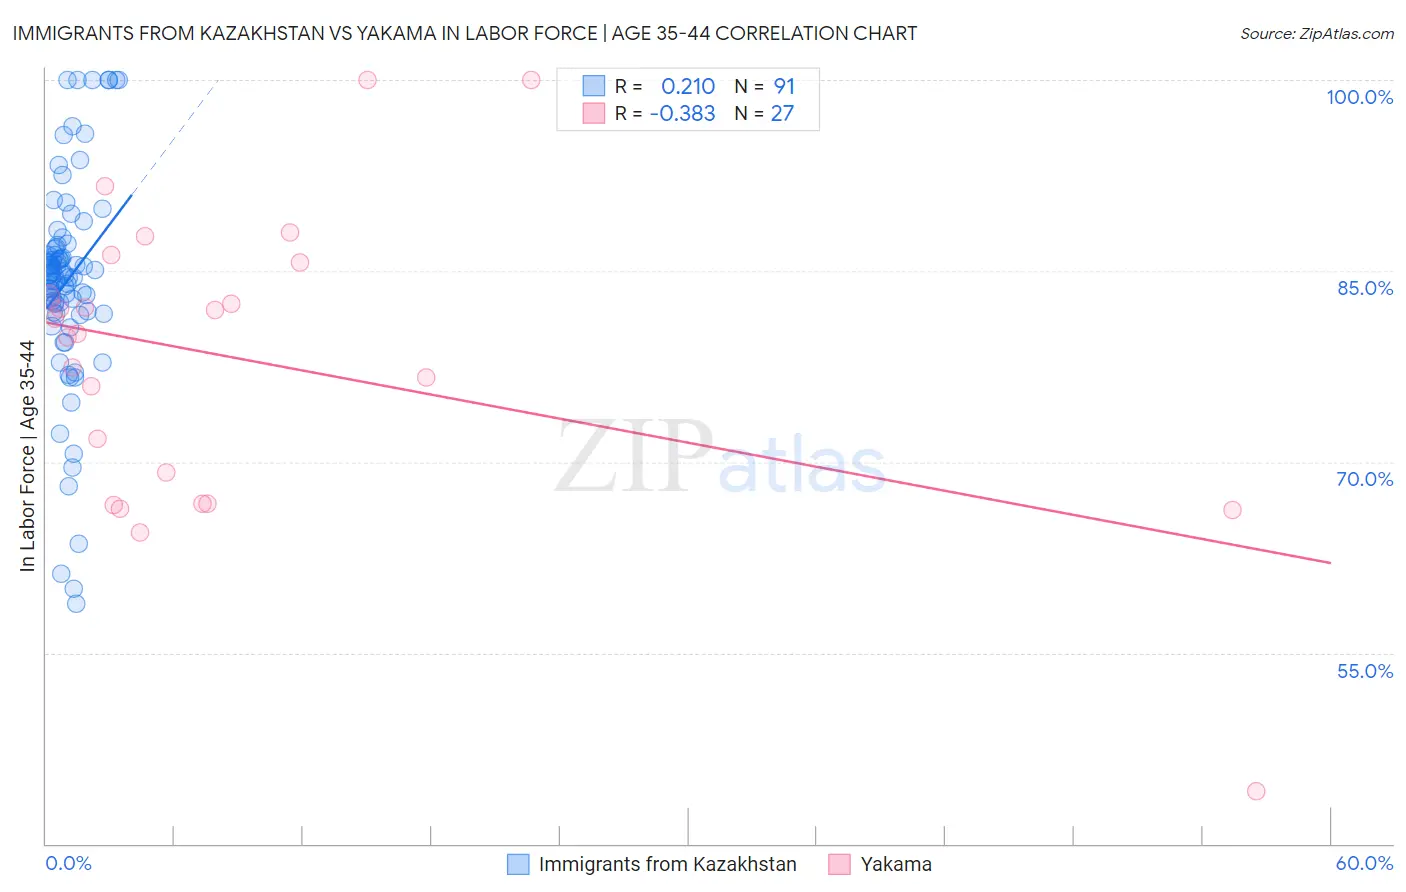
Immigrants from Kazakhstan vs Yakama In Labor Force | Age 35-44 Correlation Chart
The statistical analysis conducted on geographies consisting of 124,390,688 people shows a weak positive correlation between the proportion of Immigrants from Kazakhstan and labor force participation rate among population between the ages 35 and 44 in the United States with a correlation coefficient (R) of 0.210 and weighted average of 84.4%. Similarly, the statistical analysis conducted on geographies consisting of 19,917,241 people shows a mild negative correlation between the proportion of Yakama and labor force participation rate among population between the ages 35 and 44 in the United States with a correlation coefficient (R) of -0.383 and weighted average of 79.0%, a difference of 6.9%.
In Labor Force | Age 35-44 Correlation Summary
| Measurement | Immigrants from Kazakhstan | Yakama |
| Minimum | 58.9% | 44.1% |
| Maximum | 100.0% | 100.0% |
| Range | 41.1% | 55.9% |
| Mean | 84.2% | 77.9% |
| Median | 84.7% | 80.1% |
| Interquartile 25% (IQ1) | 81.8% | 66.7% |
| Interquartile 75% (IQ3) | 86.9% | 85.7% |
| Interquartile Range (IQR) | 5.1% | 19.0% |
| Standard Deviation (Sample) | 8.3% | 11.9% |
| Standard Deviation (Population) | 8.2% | 11.7% |
Similar Demographics by In Labor Force | Age 35-44
Demographics Similar to Immigrants from Kazakhstan by In Labor Force | Age 35-44
In terms of in labor force | age 35-44, the demographic groups most similar to Immigrants from Kazakhstan are Immigrants from Senegal (84.4%, a difference of 0.0%), Immigrants from Venezuela (84.4%, a difference of 0.0%), Immigrants from Hungary (84.4%, a difference of 0.010%), Aleut (84.4%, a difference of 0.010%), and Nigerian (84.4%, a difference of 0.010%).
| Demographics | Rating | Rank | In Labor Force | Age 35-44 |
| Trinidadians and Tobagonians | 69.5 /100 | #153 | Good 84.5% |
| Iranians | 69.4 /100 | #154 | Good 84.5% |
| Immigrants | Switzerland | 65.9 /100 | #155 | Good 84.5% |
| Immigrants | Israel | 64.3 /100 | #156 | Good 84.4% |
| Immigrants | Austria | 63.8 /100 | #157 | Good 84.4% |
| Jamaicans | 62.7 /100 | #158 | Good 84.4% |
| Immigrants | Senegal | 60.4 /100 | #159 | Good 84.4% |
| Immigrants | Kazakhstan | 60.4 /100 | #160 | Good 84.4% |
| Immigrants | Venezuela | 60.0 /100 | #161 | Good 84.4% |
| Immigrants | Hungary | 59.4 /100 | #162 | Average 84.4% |
| Aleuts | 59.1 /100 | #163 | Average 84.4% |
| Nigerians | 58.9 /100 | #164 | Average 84.4% |
| Venezuelans | 58.1 /100 | #165 | Average 84.4% |
| Alsatians | 55.2 /100 | #166 | Average 84.4% |
| Immigrants | Portugal | 55.2 /100 | #167 | Average 84.4% |
Demographics Similar to Yakama by In Labor Force | Age 35-44
In terms of in labor force | age 35-44, the demographic groups most similar to Yakama are Native/Alaskan (78.9%, a difference of 0.11%), Kiowa (79.2%, a difference of 0.29%), Ute (79.4%, a difference of 0.62%), Houma (79.5%, a difference of 0.68%), and Cheyenne (79.5%, a difference of 0.70%).
| Demographics | Rating | Rank | In Labor Force | Age 35-44 |
| Sioux | 0.0 /100 | #327 | Tragic 80.2% |
| Creek | 0.0 /100 | #328 | Tragic 80.0% |
| Menominee | 0.0 /100 | #329 | Tragic 79.7% |
| Cheyenne | 0.0 /100 | #330 | Tragic 79.5% |
| Houma | 0.0 /100 | #331 | Tragic 79.5% |
| Ute | 0.0 /100 | #332 | Tragic 79.4% |
| Kiowa | 0.0 /100 | #333 | Tragic 79.2% |
| Yakama | 0.0 /100 | #334 | Tragic 79.0% |
| Natives/Alaskans | 0.0 /100 | #335 | Tragic 78.9% |
| Arapaho | 0.0 /100 | #336 | Tragic 78.1% |
| Apache | 0.0 /100 | #337 | Tragic 77.9% |
| Pueblo | 0.0 /100 | #338 | Tragic 77.4% |
| Yup'ik | 0.0 /100 | #339 | Tragic 77.3% |
| Lumbee | 0.0 /100 | #340 | Tragic 77.0% |
| Hopi | 0.0 /100 | #341 | Tragic 77.0% |