Immigrants from Kazakhstan vs Immigrants from Eastern Europe In Labor Force | Age 35-44
COMPARE
Immigrants from Kazakhstan
Immigrants from Eastern Europe
In Labor Force | Age 35-44
In Labor Force | Age 35-44 Comparison
Immigrants from Kazakhstan
Immigrants from Eastern Europe
84.4%
IN LABOR FORCE | AGE 35-44
60.4/ 100
METRIC RATING
160th/ 347
METRIC RANK
84.9%
IN LABOR FORCE | AGE 35-44
98.3/ 100
METRIC RATING
81st/ 347
METRIC RANK
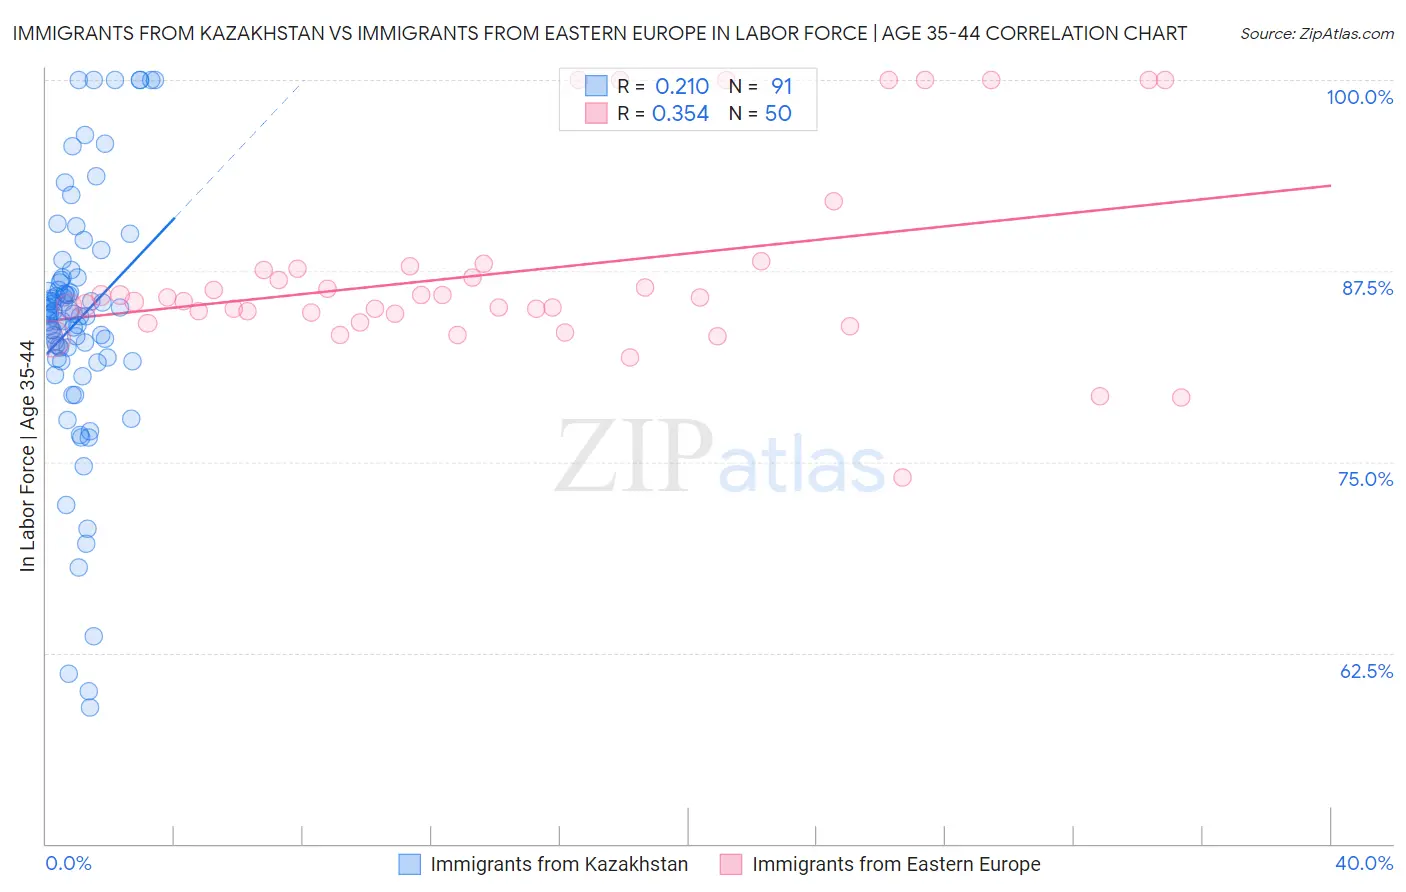
Immigrants from Kazakhstan vs Immigrants from Eastern Europe In Labor Force | Age 35-44 Correlation Chart
The statistical analysis conducted on geographies consisting of 124,390,688 people shows a weak positive correlation between the proportion of Immigrants from Kazakhstan and labor force participation rate among population between the ages 35 and 44 in the United States with a correlation coefficient (R) of 0.210 and weighted average of 84.4%. Similarly, the statistical analysis conducted on geographies consisting of 475,561,488 people shows a mild positive correlation between the proportion of Immigrants from Eastern Europe and labor force participation rate among population between the ages 35 and 44 in the United States with a correlation coefficient (R) of 0.354 and weighted average of 84.9%, a difference of 0.58%.
In Labor Force | Age 35-44 Correlation Summary
| Measurement | Immigrants from Kazakhstan | Immigrants from Eastern Europe |
| Minimum | 58.9% | 74.0% |
| Maximum | 100.0% | 100.0% |
| Range | 41.1% | 26.0% |
| Mean | 84.2% | 87.4% |
| Median | 84.7% | 85.6% |
| Interquartile 25% (IQ1) | 81.8% | 84.7% |
| Interquartile 75% (IQ3) | 86.9% | 87.6% |
| Interquartile Range (IQR) | 5.1% | 2.9% |
| Standard Deviation (Sample) | 8.3% | 6.1% |
| Standard Deviation (Population) | 8.2% | 6.1% |
Similar Demographics by In Labor Force | Age 35-44
Demographics Similar to Immigrants from Kazakhstan by In Labor Force | Age 35-44
In terms of in labor force | age 35-44, the demographic groups most similar to Immigrants from Kazakhstan are Immigrants from Senegal (84.4%, a difference of 0.0%), Immigrants from Venezuela (84.4%, a difference of 0.0%), Immigrants from Hungary (84.4%, a difference of 0.010%), Aleut (84.4%, a difference of 0.010%), and Nigerian (84.4%, a difference of 0.010%).
| Demographics | Rating | Rank | In Labor Force | Age 35-44 |
| Trinidadians and Tobagonians | 69.5 /100 | #153 | Good 84.5% |
| Iranians | 69.4 /100 | #154 | Good 84.5% |
| Immigrants | Switzerland | 65.9 /100 | #155 | Good 84.5% |
| Immigrants | Israel | 64.3 /100 | #156 | Good 84.4% |
| Immigrants | Austria | 63.8 /100 | #157 | Good 84.4% |
| Jamaicans | 62.7 /100 | #158 | Good 84.4% |
| Immigrants | Senegal | 60.4 /100 | #159 | Good 84.4% |
| Immigrants | Kazakhstan | 60.4 /100 | #160 | Good 84.4% |
| Immigrants | Venezuela | 60.0 /100 | #161 | Good 84.4% |
| Immigrants | Hungary | 59.4 /100 | #162 | Average 84.4% |
| Aleuts | 59.1 /100 | #163 | Average 84.4% |
| Nigerians | 58.9 /100 | #164 | Average 84.4% |
| Venezuelans | 58.1 /100 | #165 | Average 84.4% |
| Alsatians | 55.2 /100 | #166 | Average 84.4% |
| Immigrants | Portugal | 55.2 /100 | #167 | Average 84.4% |
Demographics Similar to Immigrants from Eastern Europe by In Labor Force | Age 35-44
In terms of in labor force | age 35-44, the demographic groups most similar to Immigrants from Eastern Europe are Peruvian (84.9%, a difference of 0.0%), Immigrants from Colombia (84.9%, a difference of 0.0%), Immigrants from Africa (84.9%, a difference of 0.010%), Immigrants from Sudan (84.9%, a difference of 0.020%), and Immigrants from Turkey (84.9%, a difference of 0.030%).
| Demographics | Rating | Rank | In Labor Force | Age 35-44 |
| Colombians | 98.8 /100 | #74 | Exceptional 85.0% |
| Immigrants | South Central Asia | 98.7 /100 | #75 | Exceptional 85.0% |
| Immigrants | Cuba | 98.6 /100 | #76 | Exceptional 84.9% |
| Immigrants | Turkey | 98.6 /100 | #77 | Exceptional 84.9% |
| Immigrants | Africa | 98.4 /100 | #78 | Exceptional 84.9% |
| Peruvians | 98.3 /100 | #79 | Exceptional 84.9% |
| Immigrants | Colombia | 98.3 /100 | #80 | Exceptional 84.9% |
| Immigrants | Eastern Europe | 98.3 /100 | #81 | Exceptional 84.9% |
| Immigrants | Sudan | 98.1 /100 | #82 | Exceptional 84.9% |
| Senegalese | 97.8 /100 | #83 | Exceptional 84.9% |
| Immigrants | Peru | 97.8 /100 | #84 | Exceptional 84.9% |
| Immigrants | Middle Africa | 97.8 /100 | #85 | Exceptional 84.9% |
| Greeks | 97.8 /100 | #86 | Exceptional 84.9% |
| Belgians | 97.7 /100 | #87 | Exceptional 84.9% |
| Yugoslavians | 97.7 /100 | #88 | Exceptional 84.9% |