Immigrants from El Salvador vs Yakama In Labor Force | Age 35-44
COMPARE
Immigrants from El Salvador
Yakama
In Labor Force | Age 35-44
In Labor Force | Age 35-44 Comparison
Immigrants from El Salvador
Yakama
83.5%
IN LABOR FORCE | AGE 35-44
0.2/ 100
METRIC RATING
259th/ 347
METRIC RANK
79.0%
IN LABOR FORCE | AGE 35-44
0.0/ 100
METRIC RATING
334th/ 347
METRIC RANK
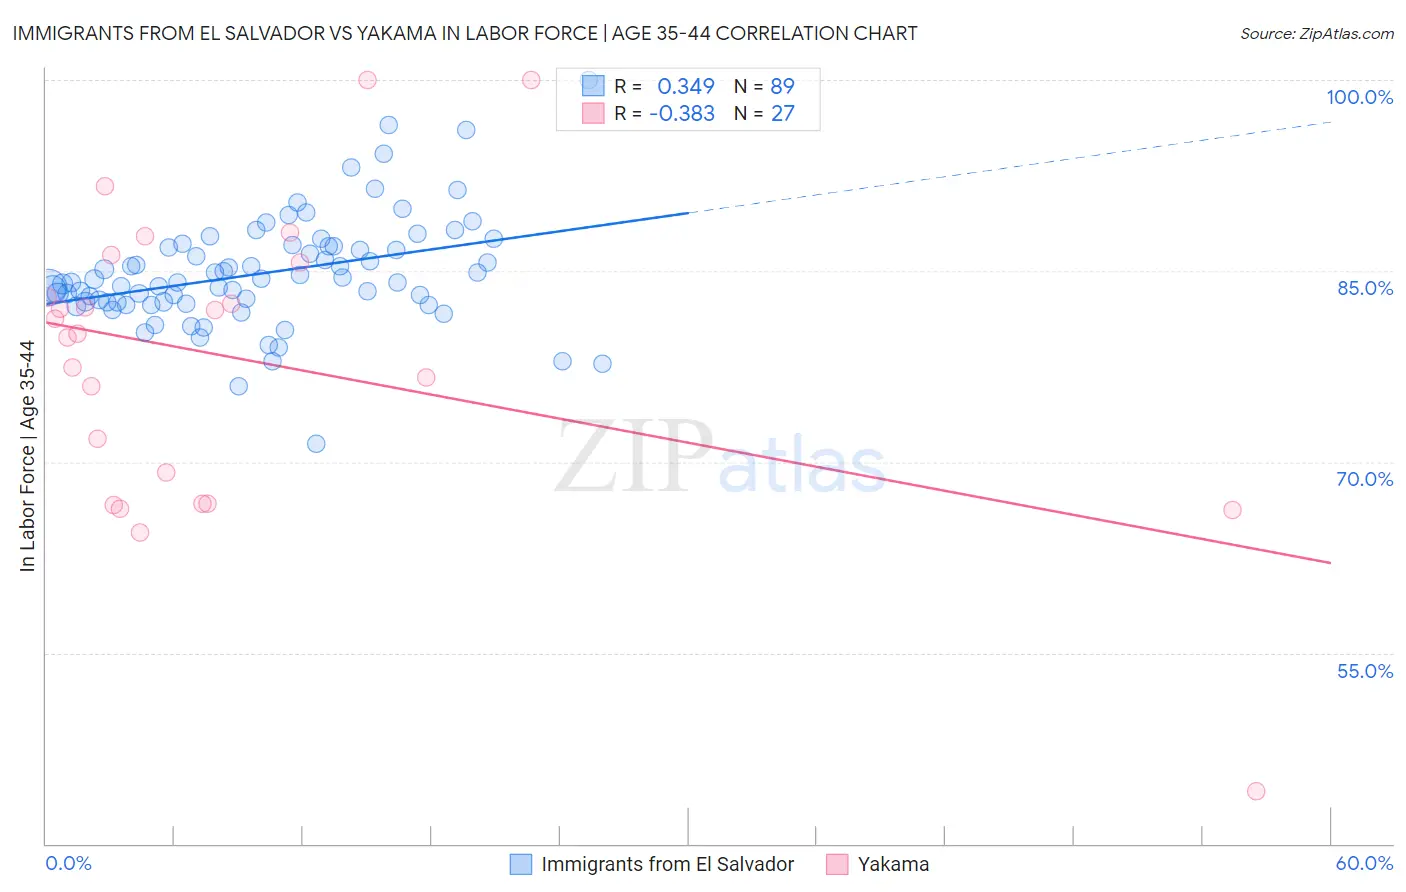
Immigrants from El Salvador vs Yakama In Labor Force | Age 35-44 Correlation Chart
The statistical analysis conducted on geographies consisting of 357,718,922 people shows a mild positive correlation between the proportion of Immigrants from El Salvador and labor force participation rate among population between the ages 35 and 44 in the United States with a correlation coefficient (R) of 0.349 and weighted average of 83.5%. Similarly, the statistical analysis conducted on geographies consisting of 19,917,241 people shows a mild negative correlation between the proportion of Yakama and labor force participation rate among population between the ages 35 and 44 in the United States with a correlation coefficient (R) of -0.383 and weighted average of 79.0%, a difference of 5.8%.
In Labor Force | Age 35-44 Correlation Summary
| Measurement | Immigrants from El Salvador | Yakama |
| Minimum | 71.4% | 44.1% |
| Maximum | 100.0% | 100.0% |
| Range | 28.6% | 55.9% |
| Mean | 84.8% | 77.9% |
| Median | 84.1% | 80.1% |
| Interquartile 25% (IQ1) | 82.5% | 66.7% |
| Interquartile 75% (IQ3) | 86.9% | 85.7% |
| Interquartile Range (IQR) | 4.4% | 19.0% |
| Standard Deviation (Sample) | 4.4% | 11.9% |
| Standard Deviation (Population) | 4.3% | 11.7% |
Similar Demographics by In Labor Force | Age 35-44
Demographics Similar to Immigrants from El Salvador by In Labor Force | Age 35-44
In terms of in labor force | age 35-44, the demographic groups most similar to Immigrants from El Salvador are Vietnamese (83.5%, a difference of 0.010%), Immigrants from Dominica (83.5%, a difference of 0.010%), Tsimshian (83.5%, a difference of 0.020%), Immigrants from Congo (83.5%, a difference of 0.020%), and Basque (83.6%, a difference of 0.050%).
| Demographics | Rating | Rank | In Labor Force | Age 35-44 |
| Immigrants | Guyana | 0.4 /100 | #252 | Tragic 83.6% |
| Lebanese | 0.4 /100 | #253 | Tragic 83.6% |
| Tongans | 0.4 /100 | #254 | Tragic 83.6% |
| Immigrants | Azores | 0.3 /100 | #255 | Tragic 83.6% |
| Japanese | 0.3 /100 | #256 | Tragic 83.6% |
| Basques | 0.3 /100 | #257 | Tragic 83.6% |
| Tsimshian | 0.2 /100 | #258 | Tragic 83.5% |
| Immigrants | El Salvador | 0.2 /100 | #259 | Tragic 83.5% |
| Vietnamese | 0.2 /100 | #260 | Tragic 83.5% |
| Immigrants | Dominica | 0.2 /100 | #261 | Tragic 83.5% |
| Immigrants | Congo | 0.2 /100 | #262 | Tragic 83.5% |
| Iroquois | 0.2 /100 | #263 | Tragic 83.5% |
| Scotch-Irish | 0.1 /100 | #264 | Tragic 83.5% |
| Central Americans | 0.1 /100 | #265 | Tragic 83.5% |
| Spaniards | 0.1 /100 | #266 | Tragic 83.4% |
Demographics Similar to Yakama by In Labor Force | Age 35-44
In terms of in labor force | age 35-44, the demographic groups most similar to Yakama are Native/Alaskan (78.9%, a difference of 0.11%), Kiowa (79.2%, a difference of 0.29%), Ute (79.4%, a difference of 0.62%), Houma (79.5%, a difference of 0.68%), and Cheyenne (79.5%, a difference of 0.70%).
| Demographics | Rating | Rank | In Labor Force | Age 35-44 |
| Sioux | 0.0 /100 | #327 | Tragic 80.2% |
| Creek | 0.0 /100 | #328 | Tragic 80.0% |
| Menominee | 0.0 /100 | #329 | Tragic 79.7% |
| Cheyenne | 0.0 /100 | #330 | Tragic 79.5% |
| Houma | 0.0 /100 | #331 | Tragic 79.5% |
| Ute | 0.0 /100 | #332 | Tragic 79.4% |
| Kiowa | 0.0 /100 | #333 | Tragic 79.2% |
| Yakama | 0.0 /100 | #334 | Tragic 79.0% |
| Natives/Alaskans | 0.0 /100 | #335 | Tragic 78.9% |
| Arapaho | 0.0 /100 | #336 | Tragic 78.1% |
| Apache | 0.0 /100 | #337 | Tragic 77.9% |
| Pueblo | 0.0 /100 | #338 | Tragic 77.4% |
| Yup'ik | 0.0 /100 | #339 | Tragic 77.3% |
| Lumbee | 0.0 /100 | #340 | Tragic 77.0% |
| Hopi | 0.0 /100 | #341 | Tragic 77.0% |