Basque vs Mexican In Labor Force | Age 25-29
COMPARE
Basque
Mexican
In Labor Force | Age 25-29
In Labor Force | Age 25-29 Comparison
Basques
Mexicans
83.4%
IN LABOR FORCE | AGE 25-29
0.0/ 100
METRIC RATING
270th/ 347
METRIC RANK
81.9%
IN LABOR FORCE | AGE 25-29
0.0/ 100
METRIC RATING
316th/ 347
METRIC RANK
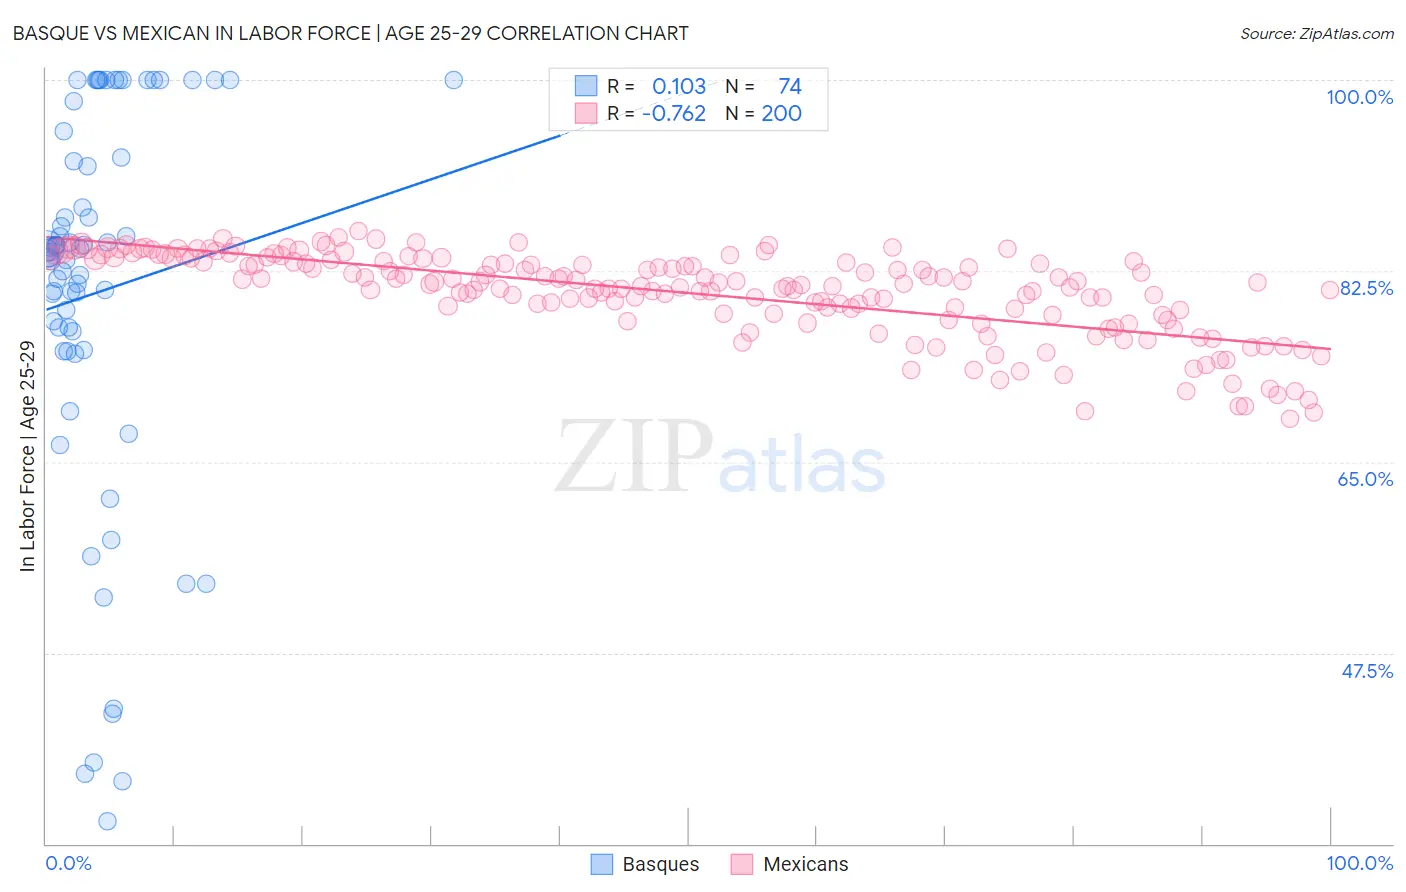
Basque vs Mexican In Labor Force | Age 25-29 Correlation Chart
The statistical analysis conducted on geographies consisting of 165,753,435 people shows a poor positive correlation between the proportion of Basques and labor force participation rate among population between the ages 25 and 29 in the United States with a correlation coefficient (R) of 0.103 and weighted average of 83.4%. Similarly, the statistical analysis conducted on geographies consisting of 564,184,194 people shows a strong negative correlation between the proportion of Mexicans and labor force participation rate among population between the ages 25 and 29 in the United States with a correlation coefficient (R) of -0.762 and weighted average of 81.9%, a difference of 1.8%.
In Labor Force | Age 25-29 Correlation Summary
| Measurement | Basque | Mexican |
| Minimum | 32.1% | 69.0% |
| Maximum | 100.0% | 86.2% |
| Range | 67.9% | 17.2% |
| Mean | 80.5% | 80.5% |
| Median | 84.3% | 81.4% |
| Interquartile 25% (IQ1) | 75.3% | 78.6% |
| Interquartile 75% (IQ3) | 92.9% | 83.5% |
| Interquartile Range (IQR) | 17.6% | 4.9% |
| Standard Deviation (Sample) | 17.7% | 3.9% |
| Standard Deviation (Population) | 17.6% | 3.9% |
Similar Demographics by In Labor Force | Age 25-29
Demographics Similar to Basques by In Labor Force | Age 25-29
In terms of in labor force | age 25-29, the demographic groups most similar to Basques are Immigrants from Barbados (83.4%, a difference of 0.010%), Spanish American (83.4%, a difference of 0.020%), Immigrants from Lebanon (83.4%, a difference of 0.020%), Honduran (83.4%, a difference of 0.020%), and Aleut (83.4%, a difference of 0.040%).
| Demographics | Rating | Rank | In Labor Force | Age 25-29 |
| West Indians | 0.1 /100 | #263 | Tragic 83.5% |
| Puget Sound Salish | 0.1 /100 | #264 | Tragic 83.5% |
| Cubans | 0.1 /100 | #265 | Tragic 83.5% |
| Aleuts | 0.0 /100 | #266 | Tragic 83.4% |
| Spanish Americans | 0.0 /100 | #267 | Tragic 83.4% |
| Immigrants | Lebanon | 0.0 /100 | #268 | Tragic 83.4% |
| Immigrants | Barbados | 0.0 /100 | #269 | Tragic 83.4% |
| Basques | 0.0 /100 | #270 | Tragic 83.4% |
| Hondurans | 0.0 /100 | #271 | Tragic 83.4% |
| Immigrants | Caribbean | 0.0 /100 | #272 | Tragic 83.4% |
| Immigrants | Dominica | 0.0 /100 | #273 | Tragic 83.4% |
| Marshallese | 0.0 /100 | #274 | Tragic 83.3% |
| Samoans | 0.0 /100 | #275 | Tragic 83.3% |
| Immigrants | Honduras | 0.0 /100 | #276 | Tragic 83.3% |
| Africans | 0.0 /100 | #277 | Tragic 83.2% |
Demographics Similar to Mexicans by In Labor Force | Age 25-29
In terms of in labor force | age 25-29, the demographic groups most similar to Mexicans are Chickasaw (81.9%, a difference of 0.070%), Immigrants from Mexico (82.0%, a difference of 0.090%), Comanche (81.9%, a difference of 0.090%), Cherokee (82.1%, a difference of 0.22%), and Yaqui (82.2%, a difference of 0.27%).
| Demographics | Rating | Rank | In Labor Force | Age 25-29 |
| Immigrants | Central America | 0.0 /100 | #309 | Tragic 82.4% |
| Osage | 0.0 /100 | #310 | Tragic 82.3% |
| Alaskan Athabascans | 0.0 /100 | #311 | Tragic 82.3% |
| Hispanics or Latinos | 0.0 /100 | #312 | Tragic 82.2% |
| Yaqui | 0.0 /100 | #313 | Tragic 82.2% |
| Cherokee | 0.0 /100 | #314 | Tragic 82.1% |
| Immigrants | Mexico | 0.0 /100 | #315 | Tragic 82.0% |
| Mexicans | 0.0 /100 | #316 | Tragic 81.9% |
| Chickasaw | 0.0 /100 | #317 | Tragic 81.9% |
| Comanche | 0.0 /100 | #318 | Tragic 81.9% |
| Seminole | 0.0 /100 | #319 | Tragic 81.7% |
| Colville | 0.0 /100 | #320 | Tragic 81.6% |
| Shoshone | 0.0 /100 | #321 | Tragic 81.6% |
| Kiowa | 0.0 /100 | #322 | Tragic 81.6% |
| Alaska Natives | 0.0 /100 | #323 | Tragic 81.6% |