Immigrants from Jamaica vs White/Caucasian In Labor Force | Age 20-64
COMPARE
Immigrants from Jamaica
White/Caucasian
In Labor Force | Age 20-64
In Labor Force | Age 20-64 Comparison
Immigrants from Jamaica
Whites/Caucasians
79.0%
IN LABOR FORCE | AGE 20-64
2.6/ 100
METRIC RATING
238th/ 347
METRIC RANK
78.5%
IN LABOR FORCE | AGE 20-64
0.2/ 100
METRIC RATING
261st/ 347
METRIC RANK
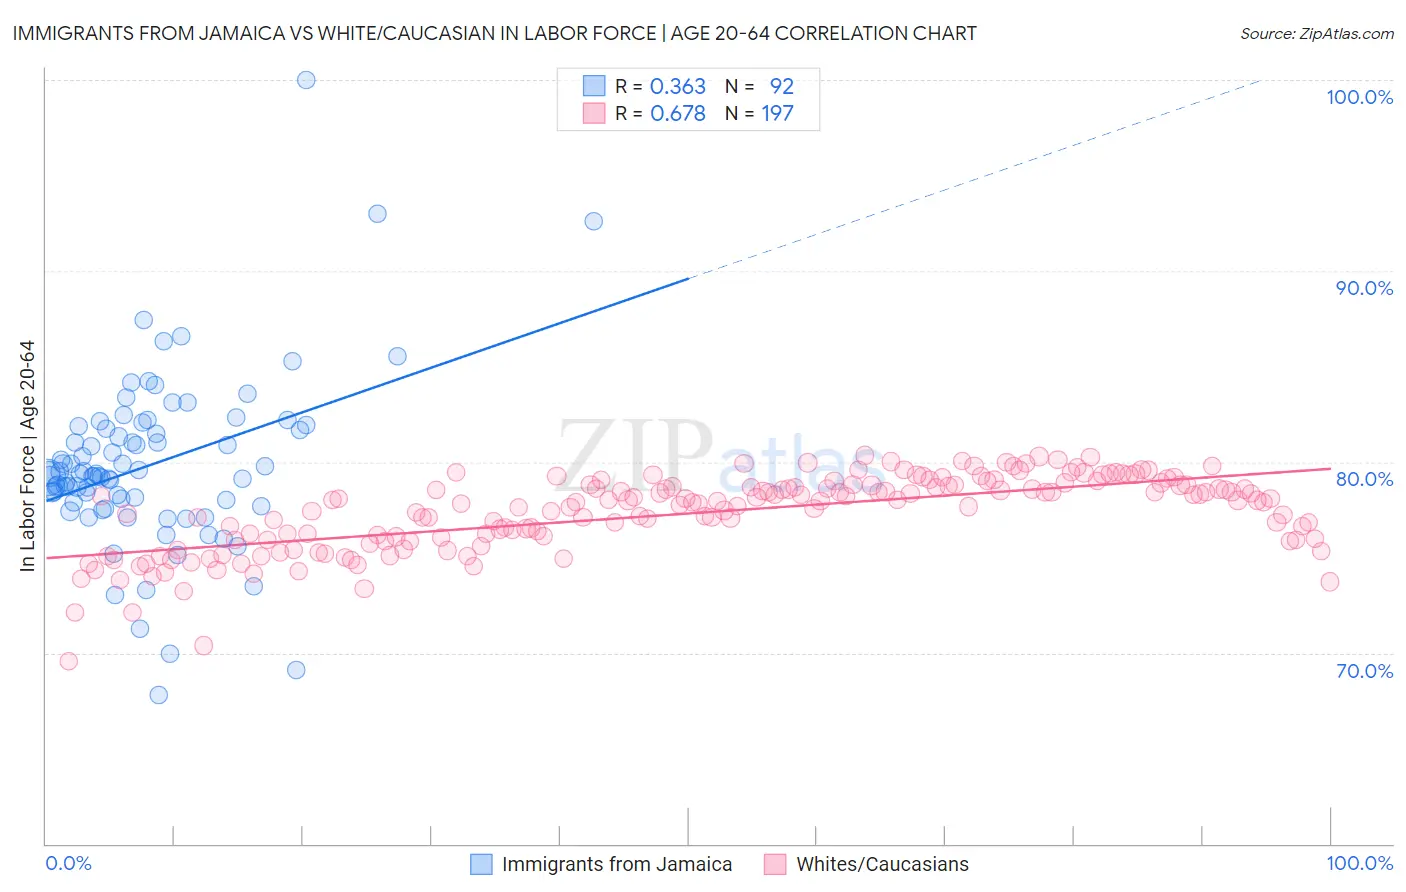
Immigrants from Jamaica vs White/Caucasian In Labor Force | Age 20-64 Correlation Chart
The statistical analysis conducted on geographies consisting of 301,819,494 people shows a mild positive correlation between the proportion of Immigrants from Jamaica and labor force participation rate among population between the ages 20 and 64 in the United States with a correlation coefficient (R) of 0.363 and weighted average of 79.0%. Similarly, the statistical analysis conducted on geographies consisting of 584,882,256 people shows a significant positive correlation between the proportion of Whites/Caucasians and labor force participation rate among population between the ages 20 and 64 in the United States with a correlation coefficient (R) of 0.678 and weighted average of 78.5%, a difference of 0.58%.
In Labor Force | Age 20-64 Correlation Summary
| Measurement | Immigrants from Jamaica | White/Caucasian |
| Minimum | 67.8% | 69.6% |
| Maximum | 100.0% | 80.3% |
| Range | 32.2% | 10.8% |
| Mean | 79.8% | 77.3% |
| Median | 79.3% | 77.9% |
| Interquartile 25% (IQ1) | 77.9% | 75.9% |
| Interquartile 75% (IQ3) | 81.8% | 78.8% |
| Interquartile Range (IQR) | 3.9% | 2.8% |
| Standard Deviation (Sample) | 4.5% | 2.0% |
| Standard Deviation (Population) | 4.5% | 2.0% |
Similar Demographics by In Labor Force | Age 20-64
Demographics Similar to Immigrants from Jamaica by In Labor Force | Age 20-64
In terms of in labor force | age 20-64, the demographic groups most similar to Immigrants from Jamaica are Immigrants from North America (79.0%, a difference of 0.020%), Welsh (79.0%, a difference of 0.020%), Trinidadian and Tobagonian (79.0%, a difference of 0.020%), Samoan (79.0%, a difference of 0.030%), and Tlingit-Haida (79.0%, a difference of 0.040%).
| Demographics | Rating | Rank | In Labor Force | Age 20-64 |
| Lebanese | 5.1 /100 | #231 | Tragic 79.1% |
| Guamanians/Chamorros | 4.5 /100 | #232 | Tragic 79.1% |
| Japanese | 4.0 /100 | #233 | Tragic 79.1% |
| Immigrants | Canada | 3.2 /100 | #234 | Tragic 79.0% |
| Tlingit-Haida | 3.2 /100 | #235 | Tragic 79.0% |
| Samoans | 2.9 /100 | #236 | Tragic 79.0% |
| Immigrants | North America | 2.9 /100 | #237 | Tragic 79.0% |
| Immigrants | Jamaica | 2.6 /100 | #238 | Tragic 79.0% |
| Welsh | 2.4 /100 | #239 | Tragic 79.0% |
| Trinidadians and Tobagonians | 2.3 /100 | #240 | Tragic 79.0% |
| Jamaicans | 2.0 /100 | #241 | Tragic 78.9% |
| Immigrants | Micronesia | 1.9 /100 | #242 | Tragic 78.9% |
| Immigrants | West Indies | 1.7 /100 | #243 | Tragic 78.9% |
| French | 1.5 /100 | #244 | Tragic 78.9% |
| Scottish | 1.3 /100 | #245 | Tragic 78.9% |
Demographics Similar to Whites/Caucasians by In Labor Force | Age 20-64
In terms of in labor force | age 20-64, the demographic groups most similar to Whites/Caucasians are Immigrants from Fiji (78.6%, a difference of 0.11%), Fijian (78.4%, a difference of 0.13%), Pennsylvania German (78.4%, a difference of 0.14%), Spaniard (78.4%, a difference of 0.15%), and Tsimshian (78.7%, a difference of 0.18%).
| Demographics | Rating | Rank | In Labor Force | Age 20-64 |
| Immigrants | Lebanon | 0.5 /100 | #254 | Tragic 78.7% |
| Hawaiians | 0.5 /100 | #255 | Tragic 78.7% |
| Celtics | 0.5 /100 | #256 | Tragic 78.7% |
| Guatemalans | 0.4 /100 | #257 | Tragic 78.7% |
| Immigrants | Guatemala | 0.4 /100 | #258 | Tragic 78.7% |
| Tsimshian | 0.4 /100 | #259 | Tragic 78.7% |
| Immigrants | Fiji | 0.3 /100 | #260 | Tragic 78.6% |
| Whites/Caucasians | 0.2 /100 | #261 | Tragic 78.5% |
| Fijians | 0.1 /100 | #262 | Tragic 78.4% |
| Pennsylvania Germans | 0.1 /100 | #263 | Tragic 78.4% |
| Spaniards | 0.1 /100 | #264 | Tragic 78.4% |
| British West Indians | 0.1 /100 | #265 | Tragic 78.4% |
| Bahamians | 0.1 /100 | #266 | Tragic 78.4% |
| U.S. Virgin Islanders | 0.1 /100 | #267 | Tragic 78.4% |
| West Indians | 0.0 /100 | #268 | Tragic 78.3% |