Estonian vs White/Caucasian In Labor Force | Age 20-64
COMPARE
Estonian
White/Caucasian
In Labor Force | Age 20-64
In Labor Force | Age 20-64 Comparison
Estonians
Whites/Caucasians
80.0%
IN LABOR FORCE | AGE 20-64
94.0/ 100
METRIC RATING
110th/ 347
METRIC RANK
78.5%
IN LABOR FORCE | AGE 20-64
0.2/ 100
METRIC RATING
261st/ 347
METRIC RANK
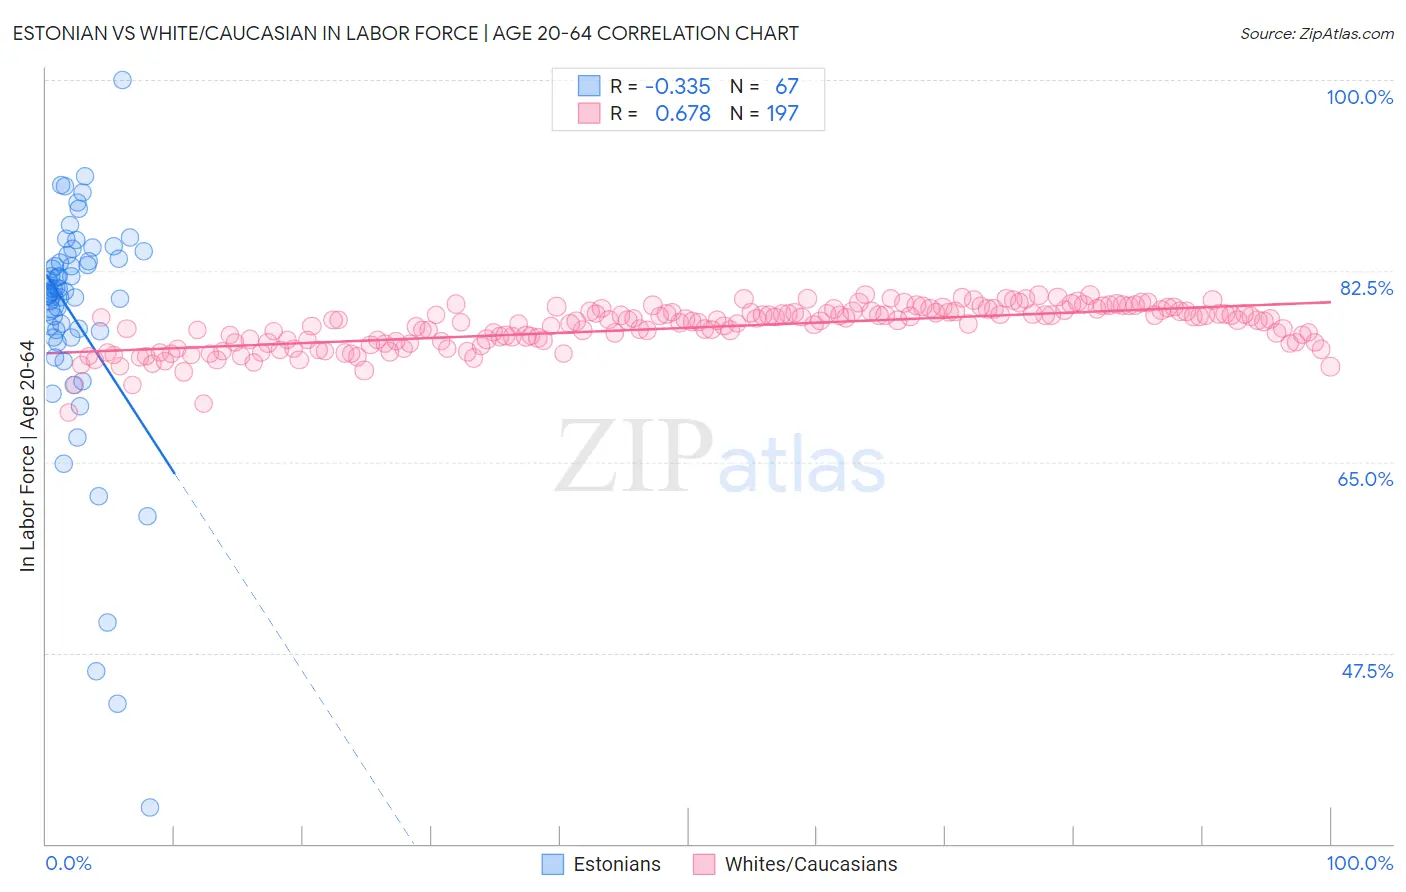
Estonian vs White/Caucasian In Labor Force | Age 20-64 Correlation Chart
The statistical analysis conducted on geographies consisting of 123,512,099 people shows a mild negative correlation between the proportion of Estonians and labor force participation rate among population between the ages 20 and 64 in the United States with a correlation coefficient (R) of -0.335 and weighted average of 80.0%. Similarly, the statistical analysis conducted on geographies consisting of 584,882,256 people shows a significant positive correlation between the proportion of Whites/Caucasians and labor force participation rate among population between the ages 20 and 64 in the United States with a correlation coefficient (R) of 0.678 and weighted average of 78.5%, a difference of 1.9%.
In Labor Force | Age 20-64 Correlation Summary
| Measurement | Estonian | White/Caucasian |
| Minimum | 33.3% | 69.6% |
| Maximum | 100.0% | 80.3% |
| Range | 66.7% | 10.8% |
| Mean | 78.1% | 77.3% |
| Median | 80.4% | 77.9% |
| Interquartile 25% (IQ1) | 76.4% | 75.9% |
| Interquartile 75% (IQ3) | 83.6% | 78.8% |
| Interquartile Range (IQR) | 7.2% | 2.8% |
| Standard Deviation (Sample) | 11.2% | 2.0% |
| Standard Deviation (Population) | 11.1% | 2.0% |
Similar Demographics by In Labor Force | Age 20-64
Demographics Similar to Estonians by In Labor Force | Age 20-64
In terms of in labor force | age 20-64, the demographic groups most similar to Estonians are Immigrants from Argentina (80.0%, a difference of 0.0%), Immigrants from South America (80.0%, a difference of 0.0%), Immigrants from Italy (80.0%, a difference of 0.0%), Sri Lankan (80.0%, a difference of 0.0%), and Iranian (80.0%, a difference of 0.010%).
| Demographics | Rating | Rank | In Labor Force | Age 20-64 |
| Russians | 95.5 /100 | #103 | Exceptional 80.0% |
| Venezuelans | 95.3 /100 | #104 | Exceptional 80.0% |
| Immigrants | Ghana | 95.0 /100 | #105 | Exceptional 80.0% |
| Greeks | 94.8 /100 | #106 | Exceptional 80.0% |
| Immigrants | Jordan | 94.8 /100 | #107 | Exceptional 80.0% |
| Iranians | 94.3 /100 | #108 | Exceptional 80.0% |
| Immigrants | Argentina | 94.1 /100 | #109 | Exceptional 80.0% |
| Estonians | 94.0 /100 | #110 | Exceptional 80.0% |
| Immigrants | South America | 93.9 /100 | #111 | Exceptional 80.0% |
| Immigrants | Italy | 93.9 /100 | #112 | Exceptional 80.0% |
| Sri Lankans | 93.9 /100 | #113 | Exceptional 80.0% |
| Argentineans | 93.8 /100 | #114 | Exceptional 80.0% |
| Bermudans | 93.3 /100 | #115 | Exceptional 80.0% |
| Immigrants | Western Africa | 93.1 /100 | #116 | Exceptional 80.0% |
| Immigrants | Vietnam | 92.7 /100 | #117 | Exceptional 80.0% |
Demographics Similar to Whites/Caucasians by In Labor Force | Age 20-64
In terms of in labor force | age 20-64, the demographic groups most similar to Whites/Caucasians are Immigrants from Fiji (78.6%, a difference of 0.11%), Fijian (78.4%, a difference of 0.13%), Pennsylvania German (78.4%, a difference of 0.14%), Spaniard (78.4%, a difference of 0.15%), and Tsimshian (78.7%, a difference of 0.18%).
| Demographics | Rating | Rank | In Labor Force | Age 20-64 |
| Immigrants | Lebanon | 0.5 /100 | #254 | Tragic 78.7% |
| Hawaiians | 0.5 /100 | #255 | Tragic 78.7% |
| Celtics | 0.5 /100 | #256 | Tragic 78.7% |
| Guatemalans | 0.4 /100 | #257 | Tragic 78.7% |
| Immigrants | Guatemala | 0.4 /100 | #258 | Tragic 78.7% |
| Tsimshian | 0.4 /100 | #259 | Tragic 78.7% |
| Immigrants | Fiji | 0.3 /100 | #260 | Tragic 78.6% |
| Whites/Caucasians | 0.2 /100 | #261 | Tragic 78.5% |
| Fijians | 0.1 /100 | #262 | Tragic 78.4% |
| Pennsylvania Germans | 0.1 /100 | #263 | Tragic 78.4% |
| Spaniards | 0.1 /100 | #264 | Tragic 78.4% |
| British West Indians | 0.1 /100 | #265 | Tragic 78.4% |
| Bahamians | 0.1 /100 | #266 | Tragic 78.4% |
| U.S. Virgin Islanders | 0.1 /100 | #267 | Tragic 78.4% |
| West Indians | 0.0 /100 | #268 | Tragic 78.3% |