Immigrants from Jamaica vs White/Caucasian Nursery School
COMPARE
Immigrants from Jamaica
White/Caucasian
Nursery School
Nursery School Comparison
Immigrants from Jamaica
Whites/Caucasians
97.5%
NURSERY SCHOOL
0.2/ 100
METRIC RATING
270th/ 347
METRIC RANK
98.5%
NURSERY SCHOOL
99.8/ 100
METRIC RATING
49th/ 347
METRIC RANK
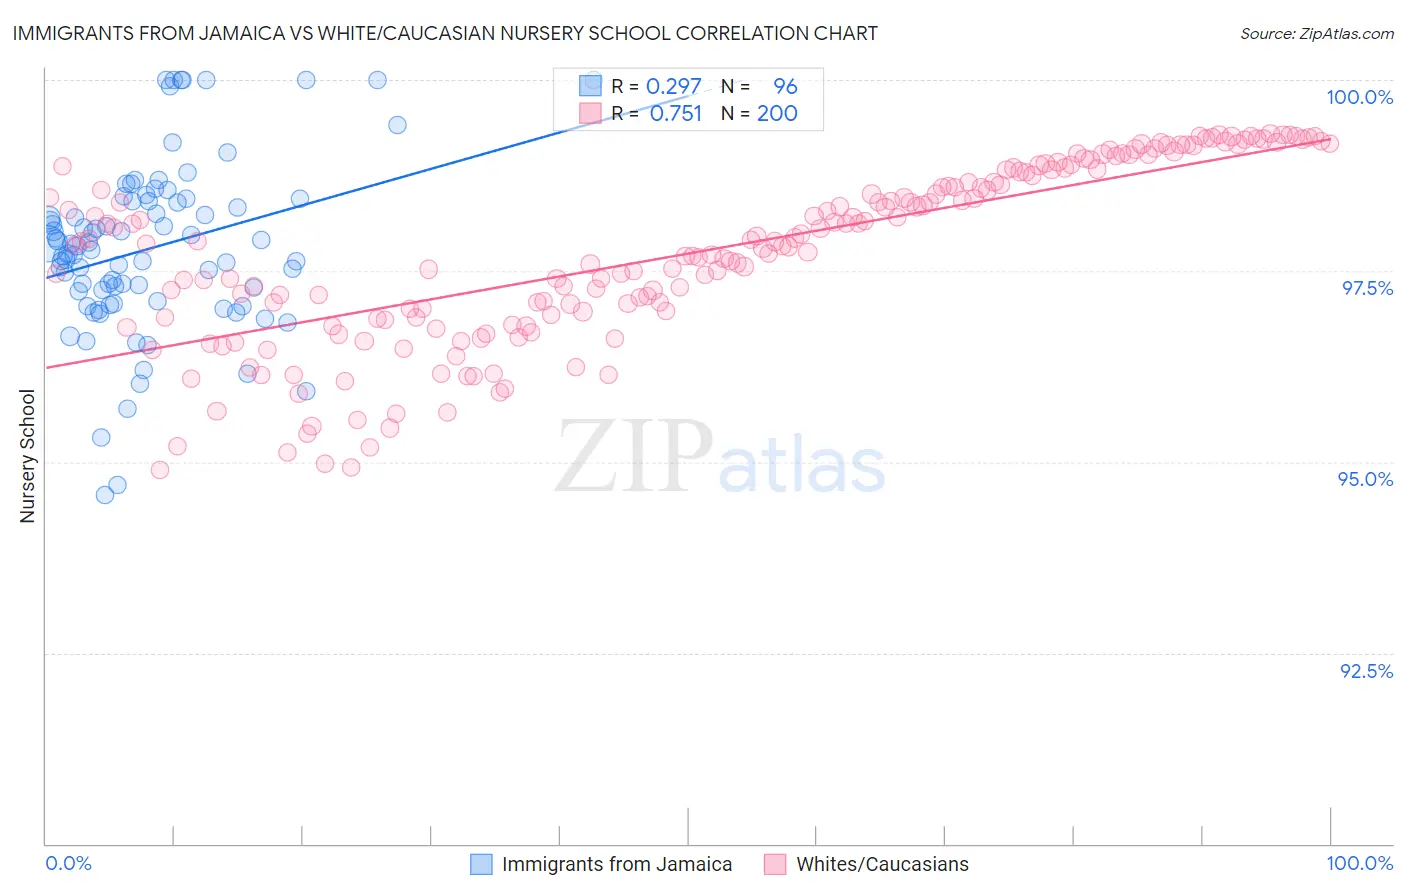
Immigrants from Jamaica vs White/Caucasian Nursery School Correlation Chart
The statistical analysis conducted on geographies consisting of 301,830,081 people shows a weak positive correlation between the proportion of Immigrants from Jamaica and percentage of population with at least nursery school education in the United States with a correlation coefficient (R) of 0.297 and weighted average of 97.5%. Similarly, the statistical analysis conducted on geographies consisting of 585,247,393 people shows a strong positive correlation between the proportion of Whites/Caucasians and percentage of population with at least nursery school education in the United States with a correlation coefficient (R) of 0.751 and weighted average of 98.5%, a difference of 0.95%.
Nursery School Correlation Summary
| Measurement | Immigrants from Jamaica | White/Caucasian |
| Minimum | 94.6% | 94.9% |
| Maximum | 100.0% | 99.3% |
| Range | 5.4% | 4.4% |
| Mean | 97.8% | 97.7% |
| Median | 97.8% | 97.8% |
| Interquartile 25% (IQ1) | 97.2% | 96.9% |
| Interquartile 75% (IQ3) | 98.4% | 98.8% |
| Interquartile Range (IQR) | 1.3% | 1.9% |
| Standard Deviation (Sample) | 1.1% | 1.2% |
| Standard Deviation (Population) | 1.1% | 1.2% |
Similar Demographics by Nursery School
Demographics Similar to Immigrants from Jamaica by Nursery School
In terms of nursery school, the demographic groups most similar to Immigrants from Jamaica are West Indian (97.5%, a difference of 0.010%), Immigrants from Liberia (97.5%, a difference of 0.010%), Immigrants from Nigeria (97.5%, a difference of 0.020%), Immigrants from Peru (97.5%, a difference of 0.020%), and Taiwanese (97.6%, a difference of 0.030%).
| Demographics | Rating | Rank | Nursery School |
| Fijians | 0.3 /100 | #263 | Tragic 97.6% |
| Taiwanese | 0.3 /100 | #264 | Tragic 97.6% |
| Assyrians/Chaldeans/Syriacs | 0.3 /100 | #265 | Tragic 97.6% |
| Immigrants | Sierra Leone | 0.3 /100 | #266 | Tragic 97.6% |
| Immigrants | Nigeria | 0.3 /100 | #267 | Tragic 97.5% |
| West Indians | 0.3 /100 | #268 | Tragic 97.5% |
| Immigrants | Liberia | 0.3 /100 | #269 | Tragic 97.5% |
| Immigrants | Jamaica | 0.2 /100 | #270 | Tragic 97.5% |
| Immigrants | Peru | 0.2 /100 | #271 | Tragic 97.5% |
| Immigrants | Bolivia | 0.1 /100 | #272 | Tragic 97.5% |
| Immigrants | China | 0.1 /100 | #273 | Tragic 97.5% |
| Immigrants | Cameroon | 0.1 /100 | #274 | Tragic 97.5% |
| Ghanaians | 0.1 /100 | #275 | Tragic 97.5% |
| Immigrants | Philippines | 0.1 /100 | #276 | Tragic 97.5% |
| Immigrants | Western Africa | 0.1 /100 | #277 | Tragic 97.4% |
Demographics Similar to Whites/Caucasians by Nursery School
In terms of nursery school, the demographic groups most similar to Whites/Caucasians are Ottawa (98.5%, a difference of 0.0%), Celtic (98.5%, a difference of 0.0%), Estonian (98.5%, a difference of 0.0%), Australian (98.5%, a difference of 0.0%), and Czechoslovakian (98.5%, a difference of 0.010%).
| Demographics | Rating | Rank | Nursery School |
| Eastern Europeans | 99.9 /100 | #42 | Exceptional 98.5% |
| Native Hawaiians | 99.9 /100 | #43 | Exceptional 98.5% |
| Belgians | 99.9 /100 | #44 | Exceptional 98.5% |
| Northern Europeans | 99.9 /100 | #45 | Exceptional 98.5% |
| Hungarians | 99.9 /100 | #46 | Exceptional 98.5% |
| Czechoslovakians | 99.9 /100 | #47 | Exceptional 98.5% |
| Ottawa | 99.8 /100 | #48 | Exceptional 98.5% |
| Whites/Caucasians | 99.8 /100 | #49 | Exceptional 98.5% |
| Celtics | 99.8 /100 | #50 | Exceptional 98.5% |
| Estonians | 99.8 /100 | #51 | Exceptional 98.5% |
| Australians | 99.8 /100 | #52 | Exceptional 98.5% |
| Kiowa | 99.8 /100 | #53 | Exceptional 98.4% |
| Pueblo | 99.8 /100 | #54 | Exceptional 98.4% |
| Immigrants | Scotland | 99.8 /100 | #55 | Exceptional 98.4% |
| Americans | 99.8 /100 | #56 | Exceptional 98.4% |