Immigrants from Jamaica vs Shoshone In Labor Force | Age 20-64
COMPARE
Immigrants from Jamaica
Shoshone
In Labor Force | Age 20-64
In Labor Force | Age 20-64 Comparison
Immigrants from Jamaica
Shoshone
79.0%
IN LABOR FORCE | AGE 20-64
2.6/ 100
METRIC RATING
238th/ 347
METRIC RANK
76.8%
IN LABOR FORCE | AGE 20-64
0.0/ 100
METRIC RATING
313th/ 347
METRIC RANK
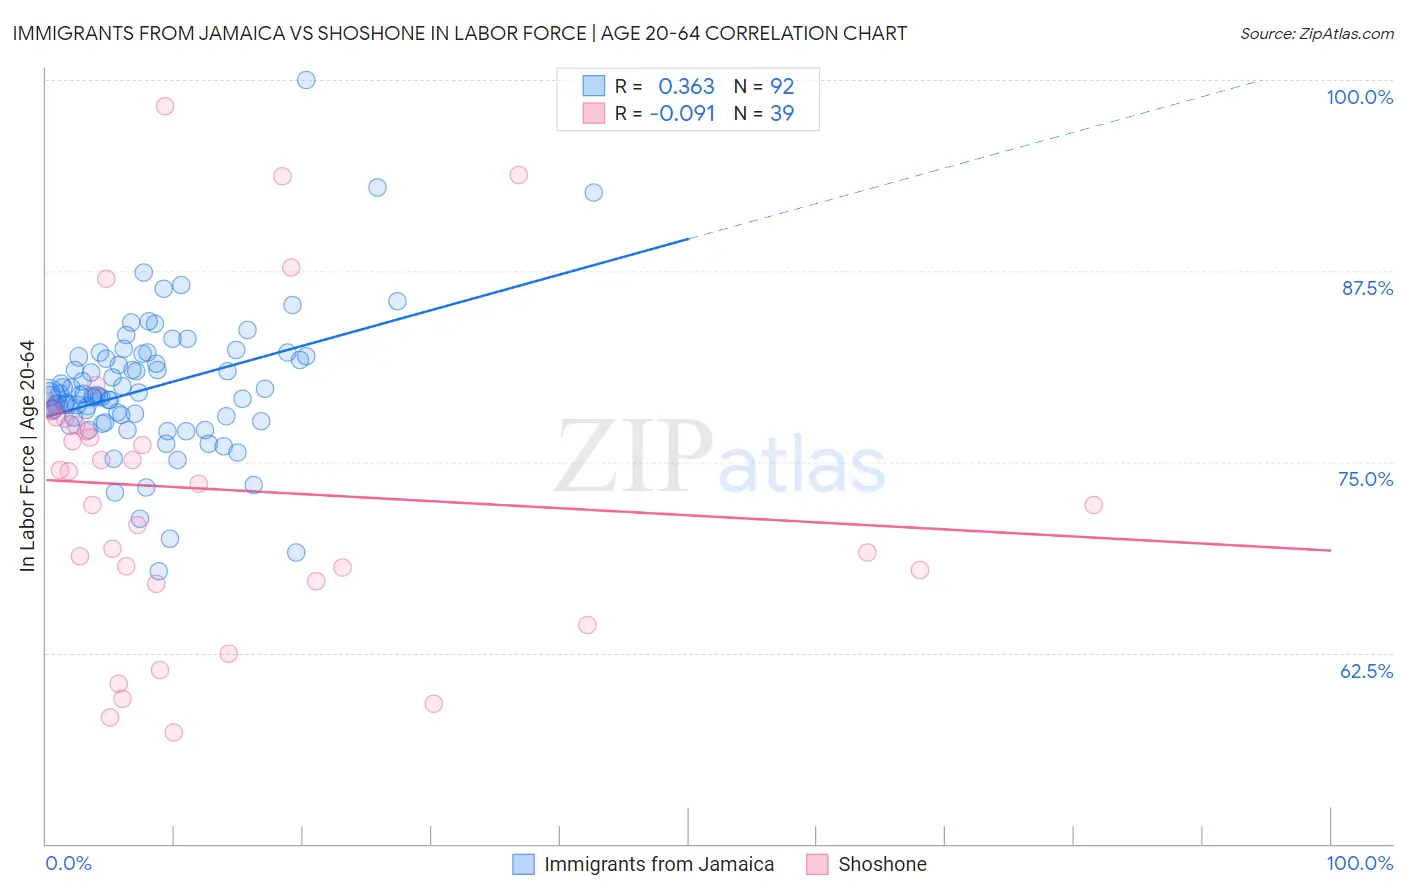
Immigrants from Jamaica vs Shoshone In Labor Force | Age 20-64 Correlation Chart
The statistical analysis conducted on geographies consisting of 301,819,494 people shows a mild positive correlation between the proportion of Immigrants from Jamaica and labor force participation rate among population between the ages 20 and 64 in the United States with a correlation coefficient (R) of 0.363 and weighted average of 79.0%. Similarly, the statistical analysis conducted on geographies consisting of 66,627,303 people shows a slight negative correlation between the proportion of Shoshone and labor force participation rate among population between the ages 20 and 64 in the United States with a correlation coefficient (R) of -0.091 and weighted average of 76.8%, a difference of 2.9%.
In Labor Force | Age 20-64 Correlation Summary
| Measurement | Immigrants from Jamaica | Shoshone |
| Minimum | 67.8% | 57.3% |
| Maximum | 100.0% | 98.3% |
| Range | 32.2% | 41.0% |
| Mean | 79.8% | 73.2% |
| Median | 79.3% | 73.6% |
| Interquartile 25% (IQ1) | 77.9% | 67.2% |
| Interquartile 75% (IQ3) | 81.8% | 77.8% |
| Interquartile Range (IQR) | 3.9% | 10.6% |
| Standard Deviation (Sample) | 4.5% | 9.8% |
| Standard Deviation (Population) | 4.5% | 9.7% |
Similar Demographics by In Labor Force | Age 20-64
Demographics Similar to Immigrants from Jamaica by In Labor Force | Age 20-64
In terms of in labor force | age 20-64, the demographic groups most similar to Immigrants from Jamaica are Immigrants from North America (79.0%, a difference of 0.020%), Welsh (79.0%, a difference of 0.020%), Trinidadian and Tobagonian (79.0%, a difference of 0.020%), Samoan (79.0%, a difference of 0.030%), and Tlingit-Haida (79.0%, a difference of 0.040%).
| Demographics | Rating | Rank | In Labor Force | Age 20-64 |
| Lebanese | 5.1 /100 | #231 | Tragic 79.1% |
| Guamanians/Chamorros | 4.5 /100 | #232 | Tragic 79.1% |
| Japanese | 4.0 /100 | #233 | Tragic 79.1% |
| Immigrants | Canada | 3.2 /100 | #234 | Tragic 79.0% |
| Tlingit-Haida | 3.2 /100 | #235 | Tragic 79.0% |
| Samoans | 2.9 /100 | #236 | Tragic 79.0% |
| Immigrants | North America | 2.9 /100 | #237 | Tragic 79.0% |
| Immigrants | Jamaica | 2.6 /100 | #238 | Tragic 79.0% |
| Welsh | 2.4 /100 | #239 | Tragic 79.0% |
| Trinidadians and Tobagonians | 2.3 /100 | #240 | Tragic 79.0% |
| Jamaicans | 2.0 /100 | #241 | Tragic 78.9% |
| Immigrants | Micronesia | 1.9 /100 | #242 | Tragic 78.9% |
| Immigrants | West Indies | 1.7 /100 | #243 | Tragic 78.9% |
| French | 1.5 /100 | #244 | Tragic 78.9% |
| Scottish | 1.3 /100 | #245 | Tragic 78.9% |
Demographics Similar to Shoshone by In Labor Force | Age 20-64
In terms of in labor force | age 20-64, the demographic groups most similar to Shoshone are Black/African American (76.8%, a difference of 0.020%), Alaskan Athabascan (76.9%, a difference of 0.12%), Ottawa (76.7%, a difference of 0.12%), Blackfeet (77.0%, a difference of 0.29%), and Yaqui (76.5%, a difference of 0.31%).
| Demographics | Rating | Rank | In Labor Force | Age 20-64 |
| Potawatomi | 0.0 /100 | #306 | Tragic 77.2% |
| Central American Indians | 0.0 /100 | #307 | Tragic 77.1% |
| Alaska Natives | 0.0 /100 | #308 | Tragic 77.0% |
| Americans | 0.0 /100 | #309 | Tragic 77.0% |
| Comanche | 0.0 /100 | #310 | Tragic 77.0% |
| Blackfeet | 0.0 /100 | #311 | Tragic 77.0% |
| Alaskan Athabascans | 0.0 /100 | #312 | Tragic 76.9% |
| Shoshone | 0.0 /100 | #313 | Tragic 76.8% |
| Blacks/African Americans | 0.0 /100 | #314 | Tragic 76.8% |
| Ottawa | 0.0 /100 | #315 | Tragic 76.7% |
| Yaqui | 0.0 /100 | #316 | Tragic 76.5% |
| Cherokee | 0.0 /100 | #317 | Tragic 76.2% |
| Chickasaw | 0.0 /100 | #318 | Tragic 76.2% |
| Inupiat | 0.0 /100 | #319 | Tragic 76.1% |
| Yakama | 0.0 /100 | #320 | Tragic 75.8% |