Immigrants from Italy vs Welsh In Labor Force | Age 30-34
COMPARE
Immigrants from Italy
Welsh
In Labor Force | Age 30-34
In Labor Force | Age 30-34 Comparison
Immigrants from Italy
Welsh
85.7%
IN LABOR FORCE | AGE 30-34
99.9/ 100
METRIC RATING
41st/ 347
METRIC RANK
84.2%
IN LABOR FORCE | AGE 30-34
2.7/ 100
METRIC RATING
229th/ 347
METRIC RANK
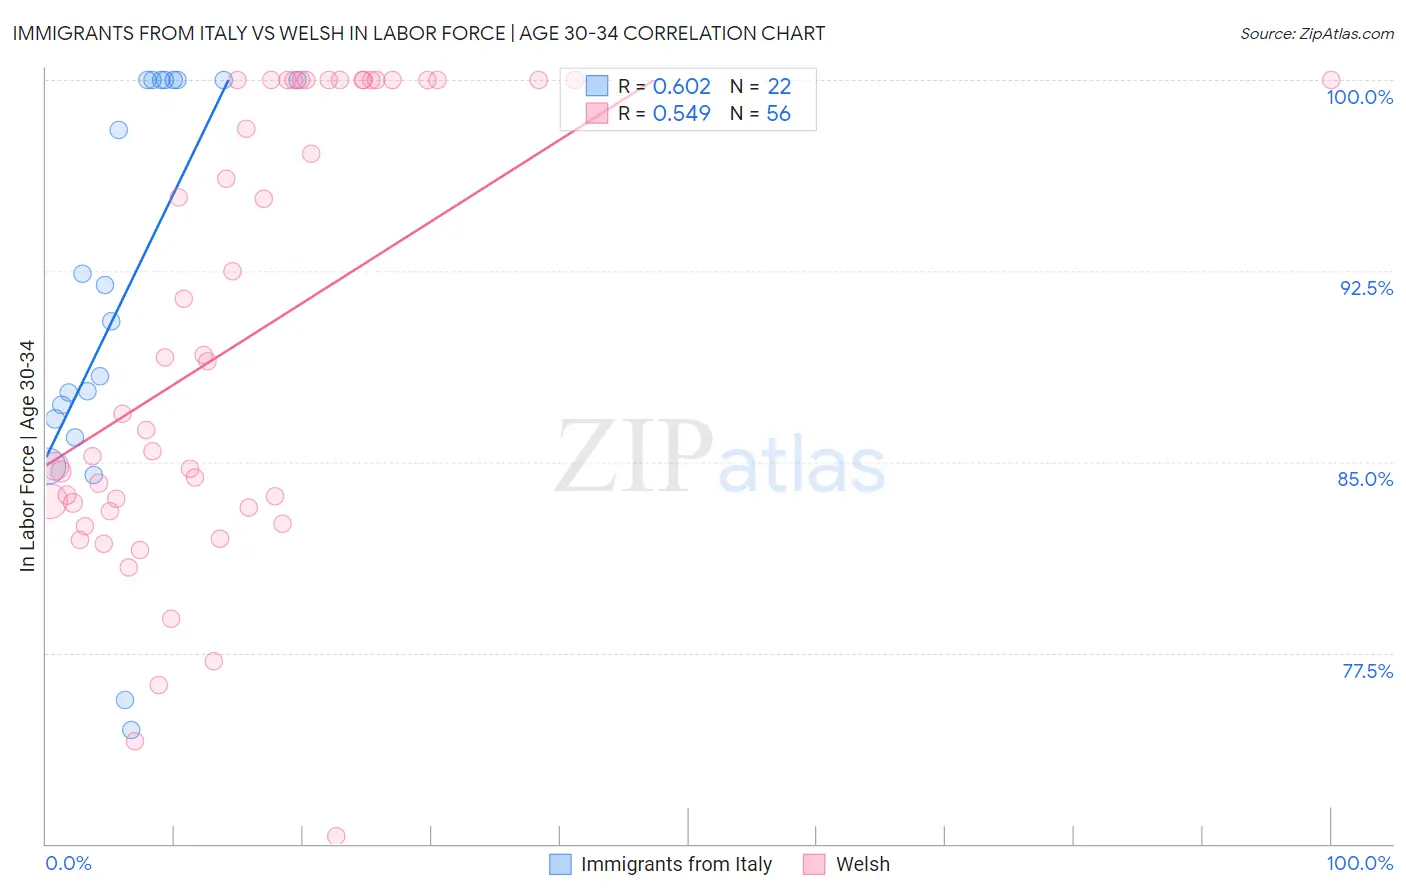
Immigrants from Italy vs Welsh In Labor Force | Age 30-34 Correlation Chart
The statistical analysis conducted on geographies consisting of 324,081,928 people shows a significant positive correlation between the proportion of Immigrants from Italy and labor force participation rate among population between the ages 30 and 34 in the United States with a correlation coefficient (R) of 0.602 and weighted average of 85.7%. Similarly, the statistical analysis conducted on geographies consisting of 527,874,569 people shows a substantial positive correlation between the proportion of Welsh and labor force participation rate among population between the ages 30 and 34 in the United States with a correlation coefficient (R) of 0.549 and weighted average of 84.2%, a difference of 1.8%.
In Labor Force | Age 30-34 Correlation Summary
| Measurement | Immigrants from Italy | Welsh |
| Minimum | 74.5% | 70.3% |
| Maximum | 100.0% | 100.0% |
| Range | 25.5% | 29.7% |
| Mean | 91.6% | 89.9% |
| Median | 91.3% | 87.9% |
| Interquartile 25% (IQ1) | 86.7% | 83.3% |
| Interquartile 75% (IQ3) | 100.0% | 100.0% |
| Interquartile Range (IQR) | 13.3% | 16.7% |
| Standard Deviation (Sample) | 8.1% | 8.7% |
| Standard Deviation (Population) | 7.9% | 8.6% |
Similar Demographics by In Labor Force | Age 30-34
Demographics Similar to Immigrants from Italy by In Labor Force | Age 30-34
In terms of in labor force | age 30-34, the demographic groups most similar to Immigrants from Italy are Zimbabwean (85.6%, a difference of 0.010%), Immigrants from Lithuania (85.6%, a difference of 0.010%), Turkish (85.7%, a difference of 0.030%), Immigrants from Sri Lanka (85.6%, a difference of 0.040%), and Immigrants from Nepal (85.6%, a difference of 0.040%).
| Demographics | Rating | Rank | In Labor Force | Age 30-34 |
| Ugandans | 99.9 /100 | #34 | Exceptional 85.8% |
| Serbians | 99.9 /100 | #35 | Exceptional 85.8% |
| Albanians | 99.9 /100 | #36 | Exceptional 85.7% |
| Norwegians | 99.9 /100 | #37 | Exceptional 85.7% |
| Immigrants | Greece | 99.9 /100 | #38 | Exceptional 85.7% |
| Eastern Europeans | 99.9 /100 | #39 | Exceptional 85.7% |
| Turks | 99.9 /100 | #40 | Exceptional 85.7% |
| Immigrants | Italy | 99.9 /100 | #41 | Exceptional 85.7% |
| Zimbabweans | 99.8 /100 | #42 | Exceptional 85.6% |
| Immigrants | Lithuania | 99.8 /100 | #43 | Exceptional 85.6% |
| Immigrants | Sri Lanka | 99.8 /100 | #44 | Exceptional 85.6% |
| Immigrants | Nepal | 99.8 /100 | #45 | Exceptional 85.6% |
| Immigrants | Morocco | 99.8 /100 | #46 | Exceptional 85.6% |
| Croatians | 99.8 /100 | #47 | Exceptional 85.6% |
| Immigrants | Sweden | 99.8 /100 | #48 | Exceptional 85.6% |
Demographics Similar to Welsh by In Labor Force | Age 30-34
In terms of in labor force | age 30-34, the demographic groups most similar to Welsh are Immigrants from Cuba (84.2%, a difference of 0.010%), Immigrants from Haiti (84.2%, a difference of 0.010%), Immigrants from Bahamas (84.1%, a difference of 0.010%), Scottish (84.2%, a difference of 0.020%), and Immigrants from El Salvador (84.2%, a difference of 0.020%).
| Demographics | Rating | Rank | In Labor Force | Age 30-34 |
| Panamanians | 3.8 /100 | #222 | Tragic 84.2% |
| Immigrants | Laos | 3.6 /100 | #223 | Tragic 84.2% |
| Cubans | 3.4 /100 | #224 | Tragic 84.2% |
| Scottish | 3.1 /100 | #225 | Tragic 84.2% |
| Immigrants | El Salvador | 3.0 /100 | #226 | Tragic 84.2% |
| Immigrants | Cuba | 3.0 /100 | #227 | Tragic 84.2% |
| Immigrants | Haiti | 2.8 /100 | #228 | Tragic 84.2% |
| Welsh | 2.7 /100 | #229 | Tragic 84.2% |
| Immigrants | Bahamas | 2.6 /100 | #230 | Tragic 84.1% |
| Malaysians | 2.2 /100 | #231 | Tragic 84.1% |
| Immigrants | Immigrants | 2.0 /100 | #232 | Tragic 84.1% |
| West Indians | 1.9 /100 | #233 | Tragic 84.1% |
| Haitians | 1.8 /100 | #234 | Tragic 84.1% |
| French American Indians | 1.7 /100 | #235 | Tragic 84.1% |
| U.S. Virgin Islanders | 1.5 /100 | #236 | Tragic 84.1% |