Immigrants from Italy vs Croatian In Labor Force | Age 30-34
COMPARE
Immigrants from Italy
Croatian
In Labor Force | Age 30-34
In Labor Force | Age 30-34 Comparison
Immigrants from Italy
Croatians
85.7%
IN LABOR FORCE | AGE 30-34
99.9/ 100
METRIC RATING
41st/ 347
METRIC RANK
85.6%
IN LABOR FORCE | AGE 30-34
99.8/ 100
METRIC RATING
47th/ 347
METRIC RANK
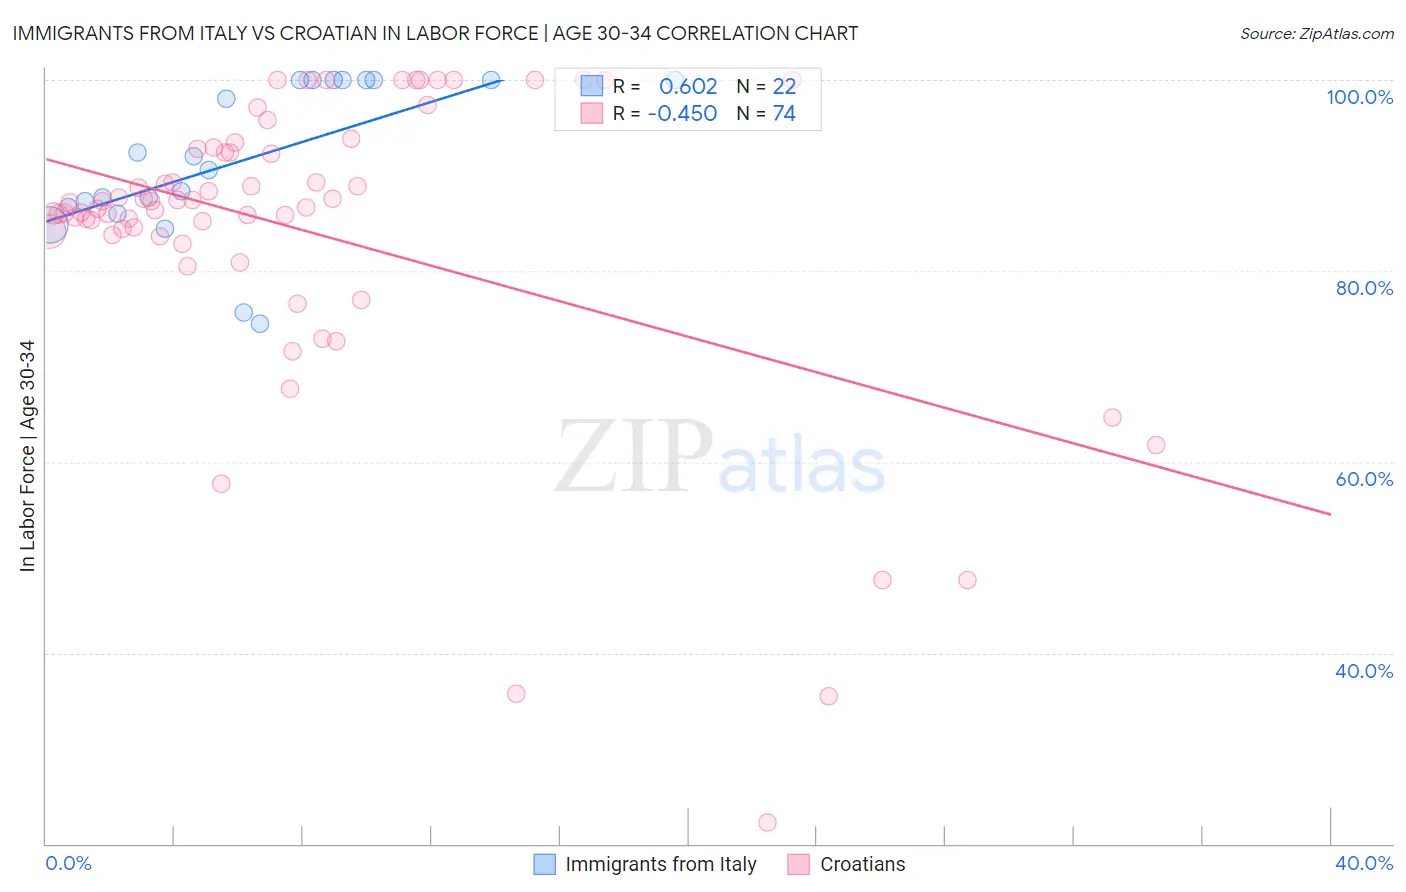
Immigrants from Italy vs Croatian In Labor Force | Age 30-34 Correlation Chart
The statistical analysis conducted on geographies consisting of 324,081,928 people shows a significant positive correlation between the proportion of Immigrants from Italy and labor force participation rate among population between the ages 30 and 34 in the United States with a correlation coefficient (R) of 0.602 and weighted average of 85.7%. Similarly, the statistical analysis conducted on geographies consisting of 375,472,504 people shows a moderate negative correlation between the proportion of Croatians and labor force participation rate among population between the ages 30 and 34 in the United States with a correlation coefficient (R) of -0.450 and weighted average of 85.6%, a difference of 0.050%.
In Labor Force | Age 30-34 Correlation Summary
| Measurement | Immigrants from Italy | Croatian |
| Minimum | 74.5% | 22.2% |
| Maximum | 100.0% | 100.0% |
| Range | 25.5% | 77.8% |
| Mean | 91.6% | 84.1% |
| Median | 91.3% | 86.9% |
| Interquartile 25% (IQ1) | 86.7% | 83.7% |
| Interquartile 75% (IQ3) | 100.0% | 92.8% |
| Interquartile Range (IQR) | 13.3% | 9.0% |
| Standard Deviation (Sample) | 8.1% | 15.7% |
| Standard Deviation (Population) | 7.9% | 15.6% |
Demographics Similar to Immigrants from Italy and Croatians by In Labor Force | Age 30-34
In terms of in labor force | age 30-34, the demographic groups most similar to Immigrants from Italy are Zimbabwean (85.6%, a difference of 0.010%), Immigrants from Lithuania (85.6%, a difference of 0.010%), Turkish (85.7%, a difference of 0.030%), Immigrants from Sri Lanka (85.6%, a difference of 0.040%), and Immigrants from Nepal (85.6%, a difference of 0.040%). Similarly, the demographic groups most similar to Croatians are Immigrants from Morocco (85.6%, a difference of 0.0%), Immigrants from Sri Lanka (85.6%, a difference of 0.010%), Immigrants from Nepal (85.6%, a difference of 0.010%), Immigrants from Sweden (85.6%, a difference of 0.020%), and Lithuanian (85.6%, a difference of 0.020%).
| Demographics | Rating | Rank | In Labor Force | Age 30-34 |
| Ugandans | 99.9 /100 | #34 | Exceptional 85.8% |
| Serbians | 99.9 /100 | #35 | Exceptional 85.8% |
| Albanians | 99.9 /100 | #36 | Exceptional 85.7% |
| Norwegians | 99.9 /100 | #37 | Exceptional 85.7% |
| Immigrants | Greece | 99.9 /100 | #38 | Exceptional 85.7% |
| Eastern Europeans | 99.9 /100 | #39 | Exceptional 85.7% |
| Turks | 99.9 /100 | #40 | Exceptional 85.7% |
| Immigrants | Italy | 99.9 /100 | #41 | Exceptional 85.7% |
| Zimbabweans | 99.8 /100 | #42 | Exceptional 85.6% |
| Immigrants | Lithuania | 99.8 /100 | #43 | Exceptional 85.6% |
| Immigrants | Sri Lanka | 99.8 /100 | #44 | Exceptional 85.6% |
| Immigrants | Nepal | 99.8 /100 | #45 | Exceptional 85.6% |
| Immigrants | Morocco | 99.8 /100 | #46 | Exceptional 85.6% |
| Croatians | 99.8 /100 | #47 | Exceptional 85.6% |
| Immigrants | Sweden | 99.8 /100 | #48 | Exceptional 85.6% |
| Lithuanians | 99.8 /100 | #49 | Exceptional 85.6% |
| Immigrants | Australia | 99.8 /100 | #50 | Exceptional 85.6% |
| Cape Verdeans | 99.7 /100 | #51 | Exceptional 85.6% |
| Slovenes | 99.7 /100 | #52 | Exceptional 85.6% |
| Filipinos | 99.6 /100 | #53 | Exceptional 85.5% |
| Immigrants | Kenya | 99.6 /100 | #54 | Exceptional 85.5% |