Immigrants from Italy vs Immigrants from Pakistan In Labor Force | Age 30-34
COMPARE
Immigrants from Italy
Immigrants from Pakistan
In Labor Force | Age 30-34
In Labor Force | Age 30-34 Comparison
Immigrants from Italy
Immigrants from Pakistan
85.7%
IN LABOR FORCE | AGE 30-34
99.9/ 100
METRIC RATING
41st/ 347
METRIC RANK
84.9%
IN LABOR FORCE | AGE 30-34
76.2/ 100
METRIC RATING
148th/ 347
METRIC RANK
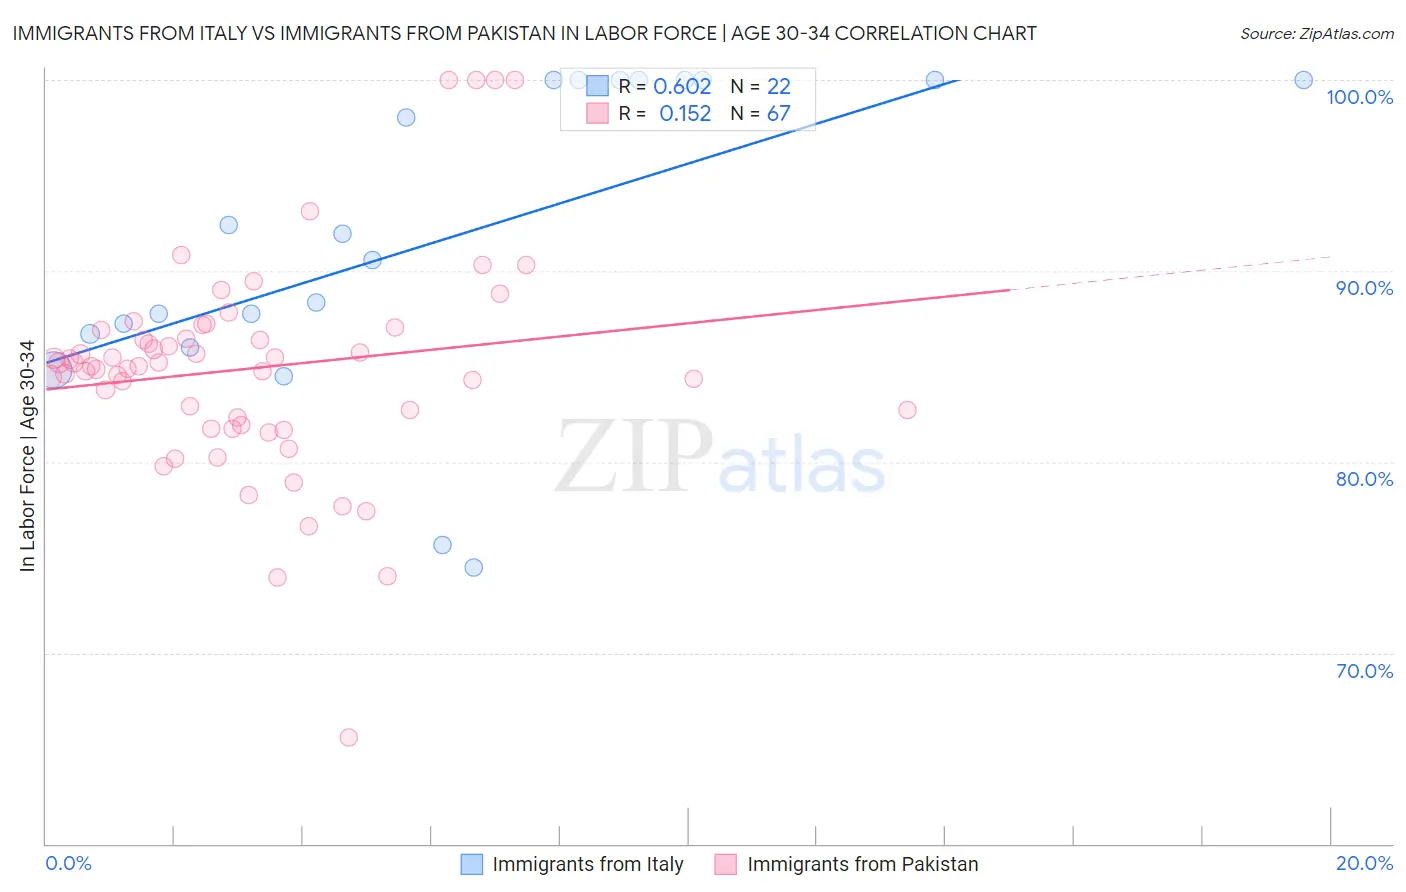
Immigrants from Italy vs Immigrants from Pakistan In Labor Force | Age 30-34 Correlation Chart
The statistical analysis conducted on geographies consisting of 324,081,928 people shows a significant positive correlation between the proportion of Immigrants from Italy and labor force participation rate among population between the ages 30 and 34 in the United States with a correlation coefficient (R) of 0.602 and weighted average of 85.7%. Similarly, the statistical analysis conducted on geographies consisting of 283,823,356 people shows a poor positive correlation between the proportion of Immigrants from Pakistan and labor force participation rate among population between the ages 30 and 34 in the United States with a correlation coefficient (R) of 0.152 and weighted average of 84.9%, a difference of 0.94%.
In Labor Force | Age 30-34 Correlation Summary
| Measurement | Immigrants from Italy | Immigrants from Pakistan |
| Minimum | 74.5% | 65.5% |
| Maximum | 100.0% | 100.0% |
| Range | 25.5% | 34.5% |
| Mean | 91.6% | 84.9% |
| Median | 91.3% | 85.0% |
| Interquartile 25% (IQ1) | 86.7% | 81.9% |
| Interquartile 75% (IQ3) | 100.0% | 86.9% |
| Interquartile Range (IQR) | 13.3% | 5.0% |
| Standard Deviation (Sample) | 8.1% | 5.8% |
| Standard Deviation (Population) | 7.9% | 5.7% |
Similar Demographics by In Labor Force | Age 30-34
Demographics Similar to Immigrants from Italy by In Labor Force | Age 30-34
In terms of in labor force | age 30-34, the demographic groups most similar to Immigrants from Italy are Zimbabwean (85.6%, a difference of 0.010%), Immigrants from Lithuania (85.6%, a difference of 0.010%), Turkish (85.7%, a difference of 0.030%), Immigrants from Sri Lanka (85.6%, a difference of 0.040%), and Immigrants from Nepal (85.6%, a difference of 0.040%).
| Demographics | Rating | Rank | In Labor Force | Age 30-34 |
| Ugandans | 99.9 /100 | #34 | Exceptional 85.8% |
| Serbians | 99.9 /100 | #35 | Exceptional 85.8% |
| Albanians | 99.9 /100 | #36 | Exceptional 85.7% |
| Norwegians | 99.9 /100 | #37 | Exceptional 85.7% |
| Immigrants | Greece | 99.9 /100 | #38 | Exceptional 85.7% |
| Eastern Europeans | 99.9 /100 | #39 | Exceptional 85.7% |
| Turks | 99.9 /100 | #40 | Exceptional 85.7% |
| Immigrants | Italy | 99.9 /100 | #41 | Exceptional 85.7% |
| Zimbabweans | 99.8 /100 | #42 | Exceptional 85.6% |
| Immigrants | Lithuania | 99.8 /100 | #43 | Exceptional 85.6% |
| Immigrants | Sri Lanka | 99.8 /100 | #44 | Exceptional 85.6% |
| Immigrants | Nepal | 99.8 /100 | #45 | Exceptional 85.6% |
| Immigrants | Morocco | 99.8 /100 | #46 | Exceptional 85.6% |
| Croatians | 99.8 /100 | #47 | Exceptional 85.6% |
| Immigrants | Sweden | 99.8 /100 | #48 | Exceptional 85.6% |
Demographics Similar to Immigrants from Pakistan by In Labor Force | Age 30-34
In terms of in labor force | age 30-34, the demographic groups most similar to Immigrants from Pakistan are Immigrants from Saudi Arabia (84.9%, a difference of 0.0%), Immigrants from Colombia (84.9%, a difference of 0.0%), Palestinian (84.9%, a difference of 0.010%), Immigrants from Ukraine (84.8%, a difference of 0.010%), and German (84.8%, a difference of 0.010%).
| Demographics | Rating | Rank | In Labor Force | Age 30-34 |
| Chileans | 85.3 /100 | #141 | Excellent 84.9% |
| Immigrants | Indonesia | 84.3 /100 | #142 | Excellent 84.9% |
| Colombians | 82.2 /100 | #143 | Excellent 84.9% |
| Uruguayans | 78.5 /100 | #144 | Good 84.9% |
| Palestinians | 77.7 /100 | #145 | Good 84.9% |
| Immigrants | Saudi Arabia | 76.6 /100 | #146 | Good 84.9% |
| Immigrants | Colombia | 76.3 /100 | #147 | Good 84.9% |
| Immigrants | Pakistan | 76.2 /100 | #148 | Good 84.9% |
| Immigrants | Ukraine | 75.1 /100 | #149 | Good 84.8% |
| Germans | 75.1 /100 | #150 | Good 84.8% |
| Immigrants | Senegal | 74.0 /100 | #151 | Good 84.8% |
| Romanians | 73.5 /100 | #152 | Good 84.8% |
| Syrians | 70.1 /100 | #153 | Good 84.8% |
| Northern Europeans | 70.0 /100 | #154 | Good 84.8% |
| Immigrants | Sudan | 69.5 /100 | #155 | Good 84.8% |