Immigrants from Italy vs Polish In Labor Force | Age 20-64
COMPARE
Immigrants from Italy
Polish
In Labor Force | Age 20-64
In Labor Force | Age 20-64 Comparison
Immigrants from Italy
Poles
80.0%
IN LABOR FORCE | AGE 20-64
93.9/ 100
METRIC RATING
112th/ 347
METRIC RANK
80.1%
IN LABOR FORCE | AGE 20-64
96.8/ 100
METRIC RATING
90th/ 347
METRIC RANK
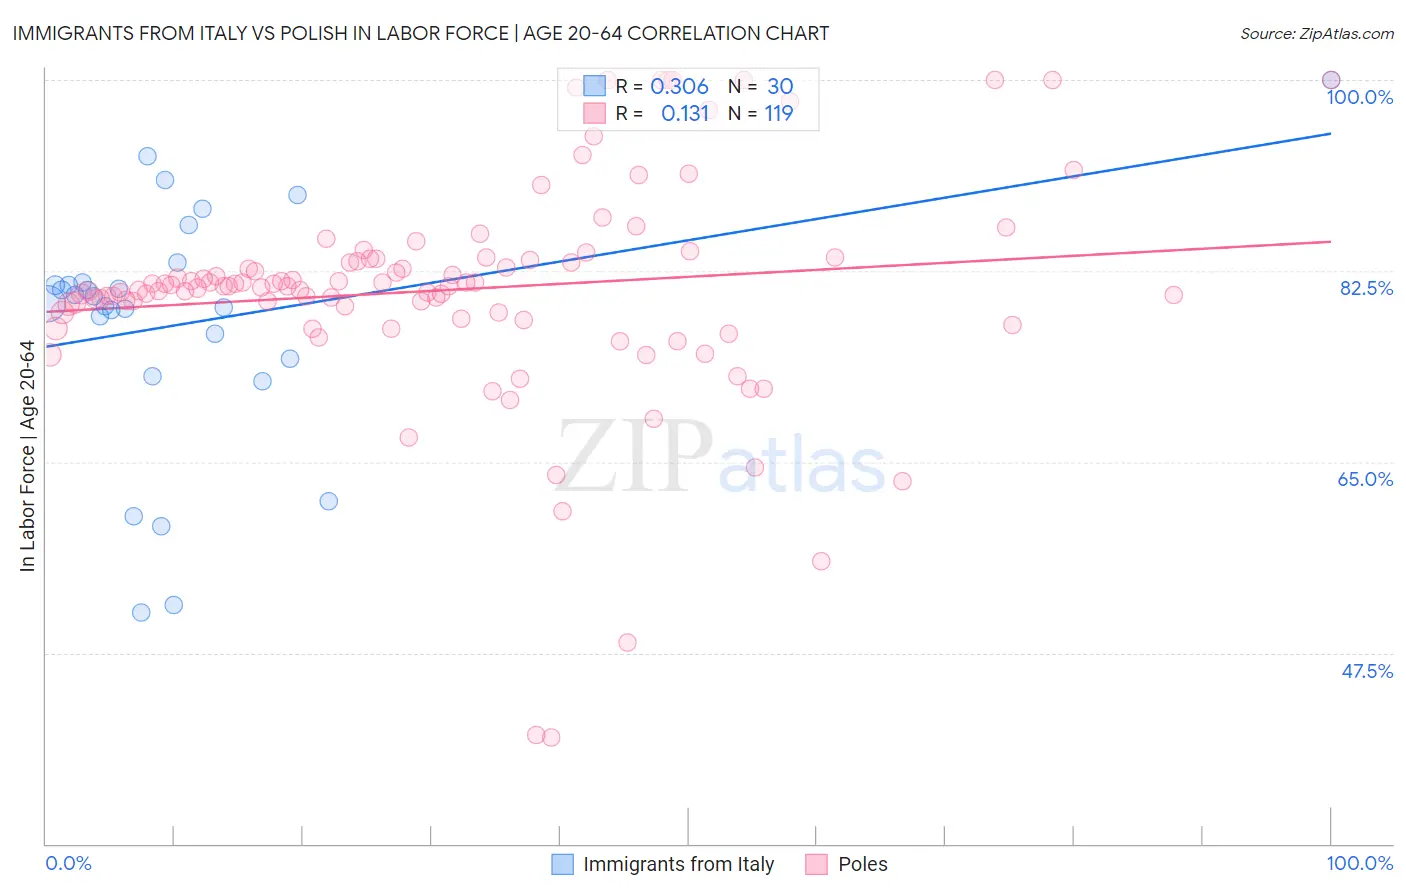
Immigrants from Italy vs Polish In Labor Force | Age 20-64 Correlation Chart
The statistical analysis conducted on geographies consisting of 324,217,381 people shows a mild positive correlation between the proportion of Immigrants from Italy and labor force participation rate among population between the ages 20 and 64 in the United States with a correlation coefficient (R) of 0.306 and weighted average of 80.0%. Similarly, the statistical analysis conducted on geographies consisting of 560,599,725 people shows a poor positive correlation between the proportion of Poles and labor force participation rate among population between the ages 20 and 64 in the United States with a correlation coefficient (R) of 0.131 and weighted average of 80.1%, a difference of 0.13%.
In Labor Force | Age 20-64 Correlation Summary
| Measurement | Immigrants from Italy | Polish |
| Minimum | 51.2% | 39.8% |
| Maximum | 100.0% | 100.0% |
| Range | 48.8% | 60.2% |
| Mean | 77.8% | 80.8% |
| Median | 79.8% | 81.1% |
| Interquartile 25% (IQ1) | 74.5% | 78.7% |
| Interquartile 75% (IQ3) | 81.5% | 83.6% |
| Interquartile Range (IQR) | 7.0% | 4.9% |
| Standard Deviation (Sample) | 11.3% | 10.2% |
| Standard Deviation (Population) | 11.1% | 10.2% |
Similar Demographics by In Labor Force | Age 20-64
Demographics Similar to Immigrants from Italy by In Labor Force | Age 20-64
In terms of in labor force | age 20-64, the demographic groups most similar to Immigrants from Italy are Estonian (80.0%, a difference of 0.0%), Immigrants from South America (80.0%, a difference of 0.0%), Sri Lankan (80.0%, a difference of 0.0%), Argentinean (80.0%, a difference of 0.0%), and Iranian (80.0%, a difference of 0.010%).
| Demographics | Rating | Rank | In Labor Force | Age 20-64 |
| Immigrants | Ghana | 95.0 /100 | #105 | Exceptional 80.0% |
| Greeks | 94.8 /100 | #106 | Exceptional 80.0% |
| Immigrants | Jordan | 94.8 /100 | #107 | Exceptional 80.0% |
| Iranians | 94.3 /100 | #108 | Exceptional 80.0% |
| Immigrants | Argentina | 94.1 /100 | #109 | Exceptional 80.0% |
| Estonians | 94.0 /100 | #110 | Exceptional 80.0% |
| Immigrants | South America | 93.9 /100 | #111 | Exceptional 80.0% |
| Immigrants | Italy | 93.9 /100 | #112 | Exceptional 80.0% |
| Sri Lankans | 93.9 /100 | #113 | Exceptional 80.0% |
| Argentineans | 93.8 /100 | #114 | Exceptional 80.0% |
| Bermudans | 93.3 /100 | #115 | Exceptional 80.0% |
| Immigrants | Western Africa | 93.1 /100 | #116 | Exceptional 80.0% |
| Immigrants | Vietnam | 92.7 /100 | #117 | Exceptional 80.0% |
| Cape Verdeans | 92.7 /100 | #118 | Exceptional 80.0% |
| Immigrants | Taiwan | 92.5 /100 | #119 | Exceptional 80.0% |
Demographics Similar to Poles by In Labor Force | Age 20-64
In terms of in labor force | age 20-64, the demographic groups most similar to Poles are Immigrants from Venezuela (80.1%, a difference of 0.0%), Uruguayan (80.1%, a difference of 0.0%), Chilean (80.1%, a difference of 0.010%), Ghanaian (80.1%, a difference of 0.010%), and Immigrants from Egypt (80.1%, a difference of 0.020%).
| Demographics | Rating | Rank | In Labor Force | Age 20-64 |
| Colombians | 97.3 /100 | #83 | Exceptional 80.1% |
| Immigrants | Latvia | 97.2 /100 | #84 | Exceptional 80.1% |
| Jordanians | 97.2 /100 | #85 | Exceptional 80.1% |
| Immigrants | Egypt | 97.1 /100 | #86 | Exceptional 80.1% |
| Croatians | 97.1 /100 | #87 | Exceptional 80.1% |
| Chileans | 97.0 /100 | #88 | Exceptional 80.1% |
| Immigrants | Venezuela | 96.8 /100 | #89 | Exceptional 80.1% |
| Poles | 96.8 /100 | #90 | Exceptional 80.1% |
| Uruguayans | 96.7 /100 | #91 | Exceptional 80.1% |
| Ghanaians | 96.7 /100 | #92 | Exceptional 80.1% |
| Immigrants | Belarus | 96.4 /100 | #93 | Exceptional 80.1% |
| Immigrants | Asia | 96.0 /100 | #94 | Exceptional 80.1% |
| Yugoslavians | 95.9 /100 | #95 | Exceptional 80.1% |
| Immigrants | Malaysia | 95.9 /100 | #96 | Exceptional 80.1% |
| South Americans | 95.9 /100 | #97 | Exceptional 80.1% |