Immigrants from India vs Tsimshian In Labor Force | Age 45-54
COMPARE
Immigrants from India
Tsimshian
In Labor Force | Age 45-54
In Labor Force | Age 45-54 Comparison
Immigrants from India
Tsimshian
84.7%
IN LABOR FORCE | AGE 45-54
100.0/ 100
METRIC RATING
6th/ 347
METRIC RANK
77.4%
IN LABOR FORCE | AGE 45-54
0.0/ 100
METRIC RATING
331st/ 347
METRIC RANK
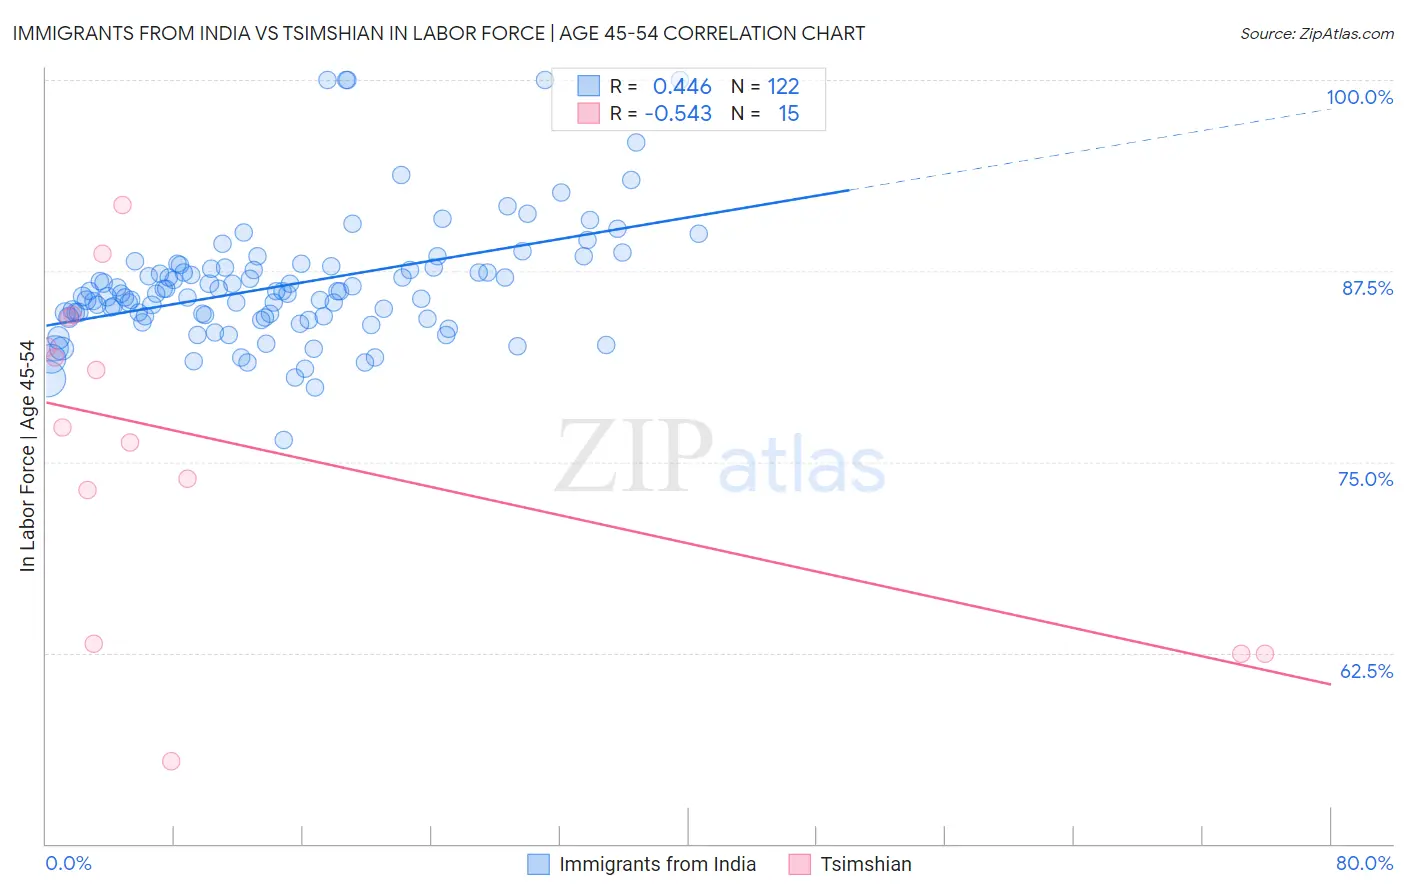
Immigrants from India vs Tsimshian In Labor Force | Age 45-54 Correlation Chart
The statistical analysis conducted on geographies consisting of 433,718,001 people shows a moderate positive correlation between the proportion of Immigrants from India and labor force participation rate among population between the ages 45 and 54 in the United States with a correlation coefficient (R) of 0.446 and weighted average of 84.7%. Similarly, the statistical analysis conducted on geographies consisting of 15,626,261 people shows a substantial negative correlation between the proportion of Tsimshian and labor force participation rate among population between the ages 45 and 54 in the United States with a correlation coefficient (R) of -0.543 and weighted average of 77.4%, a difference of 9.3%.
In Labor Force | Age 45-54 Correlation Summary
| Measurement | Immigrants from India | Tsimshian |
| Minimum | 76.4% | 55.4% |
| Maximum | 100.0% | 91.8% |
| Range | 23.6% | 36.4% |
| Mean | 86.5% | 75.9% |
| Median | 86.0% | 77.2% |
| Interquartile 25% (IQ1) | 84.5% | 63.1% |
| Interquartile 75% (IQ3) | 87.7% | 84.5% |
| Interquartile Range (IQR) | 3.2% | 21.4% |
| Standard Deviation (Sample) | 4.0% | 10.8% |
| Standard Deviation (Population) | 4.0% | 10.4% |
Similar Demographics by In Labor Force | Age 45-54
Demographics Similar to Immigrants from India by In Labor Force | Age 45-54
In terms of in labor force | age 45-54, the demographic groups most similar to Immigrants from India are Immigrants from Cameroon (84.6%, a difference of 0.070%), Ethiopian (84.8%, a difference of 0.11%), Sierra Leonean (84.5%, a difference of 0.18%), Immigrants from Ethiopia (84.8%, a difference of 0.19%), and Immigrants from Sierra Leone (84.4%, a difference of 0.28%).
| Demographics | Rating | Rank | In Labor Force | Age 45-54 |
| Immigrants | Bolivia | 100.0 /100 | #1 | Exceptional 85.3% |
| Luxembourgers | 100.0 /100 | #2 | Exceptional 85.0% |
| Bolivians | 100.0 /100 | #3 | Exceptional 84.9% |
| Immigrants | Ethiopia | 100.0 /100 | #4 | Exceptional 84.8% |
| Ethiopians | 100.0 /100 | #5 | Exceptional 84.8% |
| Immigrants | India | 100.0 /100 | #6 | Exceptional 84.7% |
| Immigrants | Cameroon | 100.0 /100 | #7 | Exceptional 84.6% |
| Sierra Leoneans | 100.0 /100 | #8 | Exceptional 84.5% |
| Immigrants | Sierra Leone | 100.0 /100 | #9 | Exceptional 84.4% |
| Norwegians | 100.0 /100 | #10 | Exceptional 84.4% |
| Thais | 100.0 /100 | #11 | Exceptional 84.3% |
| Bulgarians | 100.0 /100 | #12 | Exceptional 84.2% |
| Chinese | 99.9 /100 | #13 | Exceptional 84.1% |
| Cambodians | 99.9 /100 | #14 | Exceptional 84.1% |
| Cypriots | 99.9 /100 | #15 | Exceptional 84.1% |
Demographics Similar to Tsimshian by In Labor Force | Age 45-54
In terms of in labor force | age 45-54, the demographic groups most similar to Tsimshian are Menominee (77.4%, a difference of 0.030%), Cheyenne (77.6%, a difference of 0.15%), Creek (77.7%, a difference of 0.37%), Native/Alaskan (77.1%, a difference of 0.39%), and Apache (77.1%, a difference of 0.39%).
| Demographics | Rating | Rank | In Labor Force | Age 45-54 |
| Dutch West Indians | 0.0 /100 | #324 | Tragic 78.2% |
| Choctaw | 0.0 /100 | #325 | Tragic 78.2% |
| Seminole | 0.0 /100 | #326 | Tragic 78.1% |
| Cajuns | 0.0 /100 | #327 | Tragic 78.1% |
| Sioux | 0.0 /100 | #328 | Tragic 78.0% |
| Creek | 0.0 /100 | #329 | Tragic 77.7% |
| Cheyenne | 0.0 /100 | #330 | Tragic 77.6% |
| Tsimshian | 0.0 /100 | #331 | Tragic 77.4% |
| Menominee | 0.0 /100 | #332 | Tragic 77.4% |
| Natives/Alaskans | 0.0 /100 | #333 | Tragic 77.1% |
| Apache | 0.0 /100 | #334 | Tragic 77.1% |
| Arapaho | 0.0 /100 | #335 | Tragic 77.1% |
| Paiute | 0.0 /100 | #336 | Tragic 76.7% |
| Ute | 0.0 /100 | #337 | Tragic 76.6% |
| Yuman | 0.0 /100 | #338 | Tragic 76.3% |