Immigrants from India vs Immigrants from North Macedonia Professional Degree
COMPARE
Immigrants from India
Immigrants from North Macedonia
Professional Degree
Professional Degree Comparison
Immigrants from India
Immigrants from North Macedonia
6.2%
PROFESSIONAL DEGREE
100.0/ 100
METRIC RATING
31st/ 347
METRIC RANK
4.2%
PROFESSIONAL DEGREE
20.2/ 100
METRIC RATING
200th/ 347
METRIC RANK
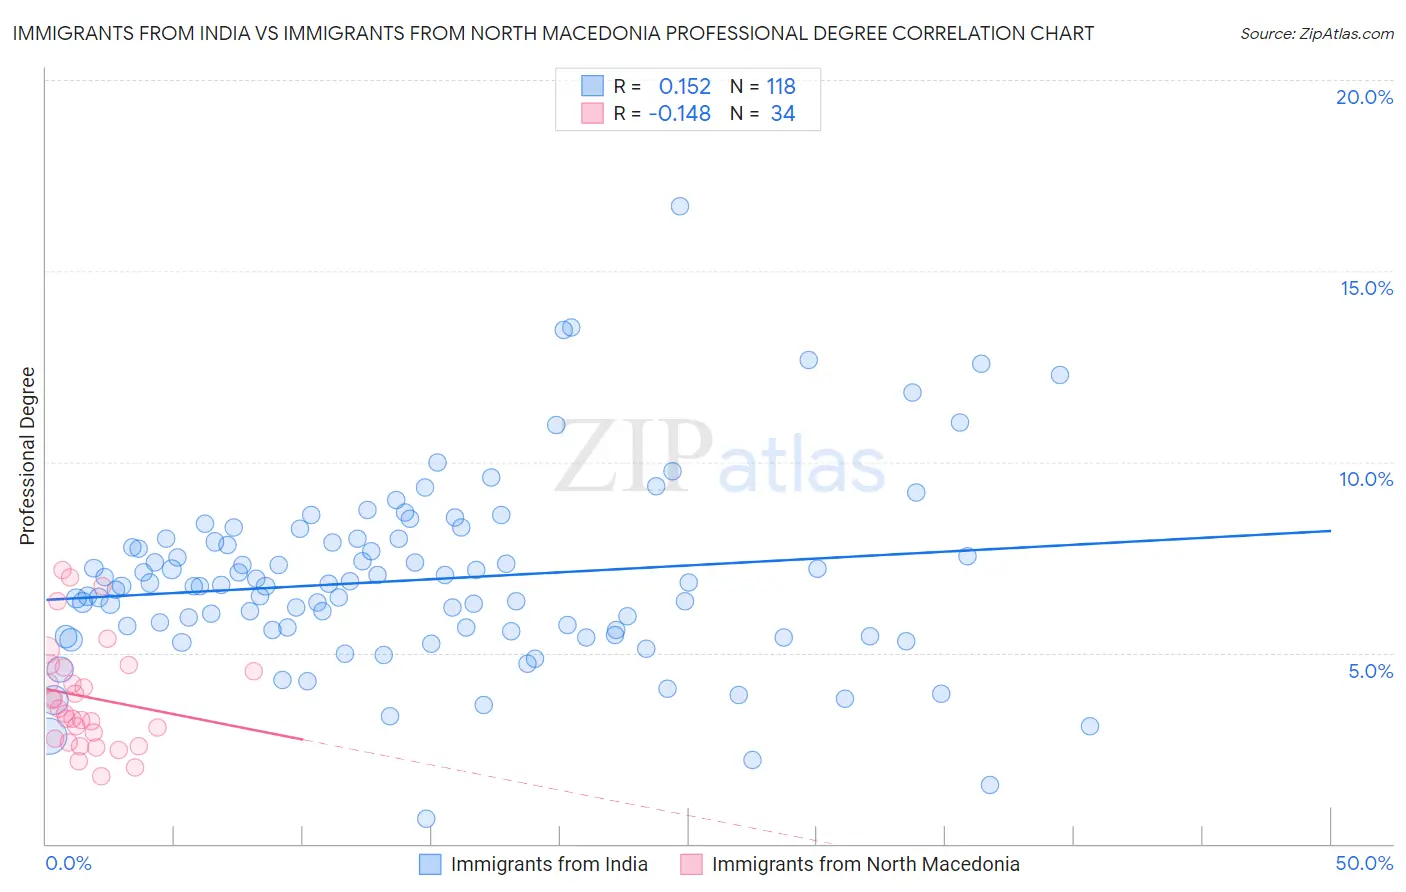
Immigrants from India vs Immigrants from North Macedonia Professional Degree Correlation Chart
The statistical analysis conducted on geographies consisting of 433,211,421 people shows a poor positive correlation between the proportion of Immigrants from India and percentage of population with at least professional degree education in the United States with a correlation coefficient (R) of 0.152 and weighted average of 6.2%. Similarly, the statistical analysis conducted on geographies consisting of 74,021,908 people shows a poor negative correlation between the proportion of Immigrants from North Macedonia and percentage of population with at least professional degree education in the United States with a correlation coefficient (R) of -0.148 and weighted average of 4.2%, a difference of 47.1%.
Professional Degree Correlation Summary
| Measurement | Immigrants from India | Immigrants from North Macedonia |
| Minimum | 0.66% | 1.8% |
| Maximum | 16.7% | 7.2% |
| Range | 16.0% | 5.4% |
| Mean | 6.9% | 3.8% |
| Median | 6.7% | 3.5% |
| Interquartile 25% (IQ1) | 5.6% | 2.8% |
| Interquartile 75% (IQ3) | 7.9% | 4.6% |
| Interquartile Range (IQR) | 2.3% | 1.8% |
| Standard Deviation (Sample) | 2.4% | 1.4% |
| Standard Deviation (Population) | 2.4% | 1.4% |
Similar Demographics by Professional Degree
Demographics Similar to Immigrants from India by Professional Degree
In terms of professional degree, the demographic groups most similar to Immigrants from India are Immigrants from Sri Lanka (6.2%, a difference of 0.12%), Immigrants from Turkey (6.2%, a difference of 0.12%), Thai (6.1%, a difference of 0.23%), Burmese (6.1%, a difference of 0.27%), and Mongolian (6.1%, a difference of 0.40%).
| Demographics | Rating | Rank | Professional Degree |
| Immigrants | Spain | 100.0 /100 | #24 | Exceptional 6.3% |
| Immigrants | Ireland | 100.0 /100 | #25 | Exceptional 6.3% |
| Latvians | 100.0 /100 | #26 | Exceptional 6.2% |
| Immigrants | Northern Europe | 100.0 /100 | #27 | Exceptional 6.2% |
| Turks | 100.0 /100 | #28 | Exceptional 6.2% |
| Immigrants | Sri Lanka | 100.0 /100 | #29 | Exceptional 6.2% |
| Immigrants | Turkey | 100.0 /100 | #30 | Exceptional 6.2% |
| Immigrants | India | 100.0 /100 | #31 | Exceptional 6.2% |
| Thais | 100.0 /100 | #32 | Exceptional 6.1% |
| Burmese | 100.0 /100 | #33 | Exceptional 6.1% |
| Mongolians | 100.0 /100 | #34 | Exceptional 6.1% |
| Immigrants | Korea | 100.0 /100 | #35 | Exceptional 6.1% |
| Immigrants | Russia | 100.0 /100 | #36 | Exceptional 6.0% |
| Immigrants | Austria | 100.0 /100 | #37 | Exceptional 6.0% |
| Immigrants | Norway | 100.0 /100 | #38 | Exceptional 6.0% |
Demographics Similar to Immigrants from North Macedonia by Professional Degree
In terms of professional degree, the demographic groups most similar to Immigrants from North Macedonia are Norwegian (4.2%, a difference of 0.080%), Finnish (4.2%, a difference of 0.36%), Immigrants from Middle Africa (4.2%, a difference of 0.44%), Czechoslovakian (4.2%, a difference of 0.50%), and Spanish (4.2%, a difference of 0.64%).
| Demographics | Rating | Rank | Professional Degree |
| French | 27.1 /100 | #193 | Fair 4.2% |
| Scandinavians | 25.8 /100 | #194 | Fair 4.2% |
| Nigerians | 24.6 /100 | #195 | Fair 4.2% |
| Spanish | 23.0 /100 | #196 | Fair 4.2% |
| Czechoslovakians | 22.4 /100 | #197 | Fair 4.2% |
| Immigrants | Middle Africa | 22.1 /100 | #198 | Fair 4.2% |
| Norwegians | 20.5 /100 | #199 | Fair 4.2% |
| Immigrants | North Macedonia | 20.2 /100 | #200 | Fair 4.2% |
| Finns | 18.7 /100 | #201 | Poor 4.2% |
| Immigrants | Iraq | 17.1 /100 | #202 | Poor 4.2% |
| Panamanians | 15.9 /100 | #203 | Poor 4.1% |
| Barbadians | 15.8 /100 | #204 | Poor 4.1% |
| Somalis | 14.8 /100 | #205 | Poor 4.1% |
| Yugoslavians | 13.4 /100 | #206 | Poor 4.1% |
| Sub-Saharan Africans | 12.8 /100 | #207 | Poor 4.1% |