Immigrants from India vs Immigrants from Eastern Europe In Labor Force | Age 20-64
COMPARE
Immigrants from India
Immigrants from Eastern Europe
In Labor Force | Age 20-64
In Labor Force | Age 20-64 Comparison
Immigrants from India
Immigrants from Eastern Europe
81.3%
IN LABOR FORCE | AGE 20-64
100.0/ 100
METRIC RATING
13th/ 347
METRIC RANK
80.2%
IN LABOR FORCE | AGE 20-64
98.1/ 100
METRIC RATING
74th/ 347
METRIC RANK
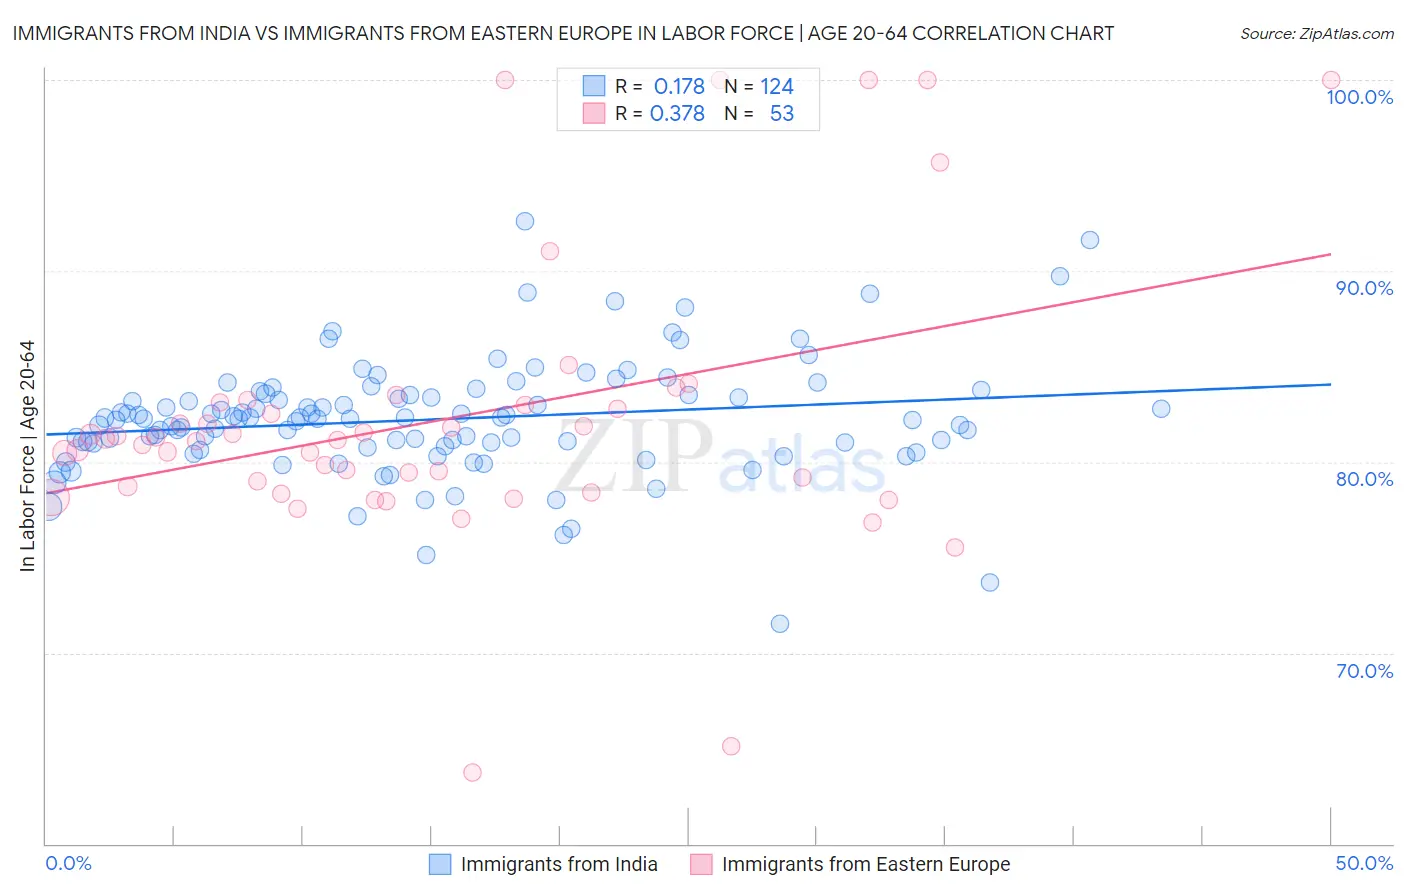
Immigrants from India vs Immigrants from Eastern Europe In Labor Force | Age 20-64 Correlation Chart
The statistical analysis conducted on geographies consisting of 434,133,401 people shows a poor positive correlation between the proportion of Immigrants from India and labor force participation rate among population between the ages 20 and 64 in the United States with a correlation coefficient (R) of 0.178 and weighted average of 81.3%. Similarly, the statistical analysis conducted on geographies consisting of 475,884,691 people shows a mild positive correlation between the proportion of Immigrants from Eastern Europe and labor force participation rate among population between the ages 20 and 64 in the United States with a correlation coefficient (R) of 0.378 and weighted average of 80.2%, a difference of 1.3%.
In Labor Force | Age 20-64 Correlation Summary
| Measurement | Immigrants from India | Immigrants from Eastern Europe |
| Minimum | 71.5% | 63.7% |
| Maximum | 92.6% | 100.0% |
| Range | 21.1% | 36.3% |
| Mean | 82.2% | 82.2% |
| Median | 82.3% | 81.1% |
| Interquartile 25% (IQ1) | 80.9% | 78.6% |
| Interquartile 75% (IQ3) | 83.5% | 83.1% |
| Interquartile Range (IQR) | 2.6% | 4.5% |
| Standard Deviation (Sample) | 3.1% | 7.4% |
| Standard Deviation (Population) | 3.1% | 7.3% |
Similar Demographics by In Labor Force | Age 20-64
Demographics Similar to Immigrants from India by In Labor Force | Age 20-64
In terms of in labor force | age 20-64, the demographic groups most similar to Immigrants from India are Immigrants from Eritrea (81.3%, a difference of 0.030%), Immigrants from Eastern Africa (81.3%, a difference of 0.060%), Cambodian (81.1%, a difference of 0.24%), Immigrants from Sierra Leone (81.5%, a difference of 0.25%), and Bulgarian (81.1%, a difference of 0.25%).
| Demographics | Rating | Rank | In Labor Force | Age 20-64 |
| Somalis | 100.0 /100 | #6 | Exceptional 81.6% |
| Immigrants | Cameroon | 100.0 /100 | #7 | Exceptional 81.6% |
| Immigrants | Somalia | 100.0 /100 | #8 | Exceptional 81.6% |
| Sierra Leoneans | 100.0 /100 | #9 | Exceptional 81.5% |
| Immigrants | Sierra Leone | 100.0 /100 | #10 | Exceptional 81.5% |
| Immigrants | Eastern Africa | 100.0 /100 | #11 | Exceptional 81.3% |
| Immigrants | Eritrea | 100.0 /100 | #12 | Exceptional 81.3% |
| Immigrants | India | 100.0 /100 | #13 | Exceptional 81.3% |
| Cambodians | 100.0 /100 | #14 | Exceptional 81.1% |
| Bulgarians | 100.0 /100 | #15 | Exceptional 81.1% |
| Immigrants | Nepal | 100.0 /100 | #16 | Exceptional 81.1% |
| Norwegians | 100.0 /100 | #17 | Exceptional 81.0% |
| Immigrants | Bulgaria | 100.0 /100 | #18 | Exceptional 81.0% |
| Zimbabweans | 100.0 /100 | #19 | Exceptional 81.0% |
| Thais | 100.0 /100 | #20 | Exceptional 80.9% |
Demographics Similar to Immigrants from Eastern Europe by In Labor Force | Age 20-64
In terms of in labor force | age 20-64, the demographic groups most similar to Immigrants from Eastern Europe are Cypriot (80.2%, a difference of 0.010%), Immigrants from Afghanistan (80.2%, a difference of 0.010%), Egyptian (80.2%, a difference of 0.030%), Immigrants from Colombia (80.2%, a difference of 0.030%), and Immigrants from Romania (80.2%, a difference of 0.030%).
| Demographics | Rating | Rank | In Labor Force | Age 20-64 |
| Taiwanese | 98.6 /100 | #67 | Exceptional 80.2% |
| Bhutanese | 98.6 /100 | #68 | Exceptional 80.2% |
| Albanians | 98.6 /100 | #69 | Exceptional 80.2% |
| Immigrants | Turkey | 98.5 /100 | #70 | Exceptional 80.2% |
| Soviet Union | 98.5 /100 | #71 | Exceptional 80.2% |
| Eastern Europeans | 98.4 /100 | #72 | Exceptional 80.2% |
| Cypriots | 98.2 /100 | #73 | Exceptional 80.2% |
| Immigrants | Eastern Europe | 98.1 /100 | #74 | Exceptional 80.2% |
| Immigrants | Afghanistan | 97.9 /100 | #75 | Exceptional 80.2% |
| Egyptians | 97.8 /100 | #76 | Exceptional 80.2% |
| Immigrants | Colombia | 97.8 /100 | #77 | Exceptional 80.2% |
| Immigrants | Romania | 97.8 /100 | #78 | Exceptional 80.2% |
| Asians | 97.7 /100 | #79 | Exceptional 80.2% |
| Immigrants | Croatia | 97.6 /100 | #80 | Exceptional 80.1% |
| German Russians | 97.3 /100 | #81 | Exceptional 80.1% |