Immigrants from India vs Brazilian In Labor Force | Age 20-64
COMPARE
Immigrants from India
Brazilian
In Labor Force | Age 20-64
In Labor Force | Age 20-64 Comparison
Immigrants from India
Brazilians
81.3%
IN LABOR FORCE | AGE 20-64
100.0/ 100
METRIC RATING
13th/ 347
METRIC RANK
80.5%
IN LABOR FORCE | AGE 20-64
99.8/ 100
METRIC RATING
39th/ 347
METRIC RANK
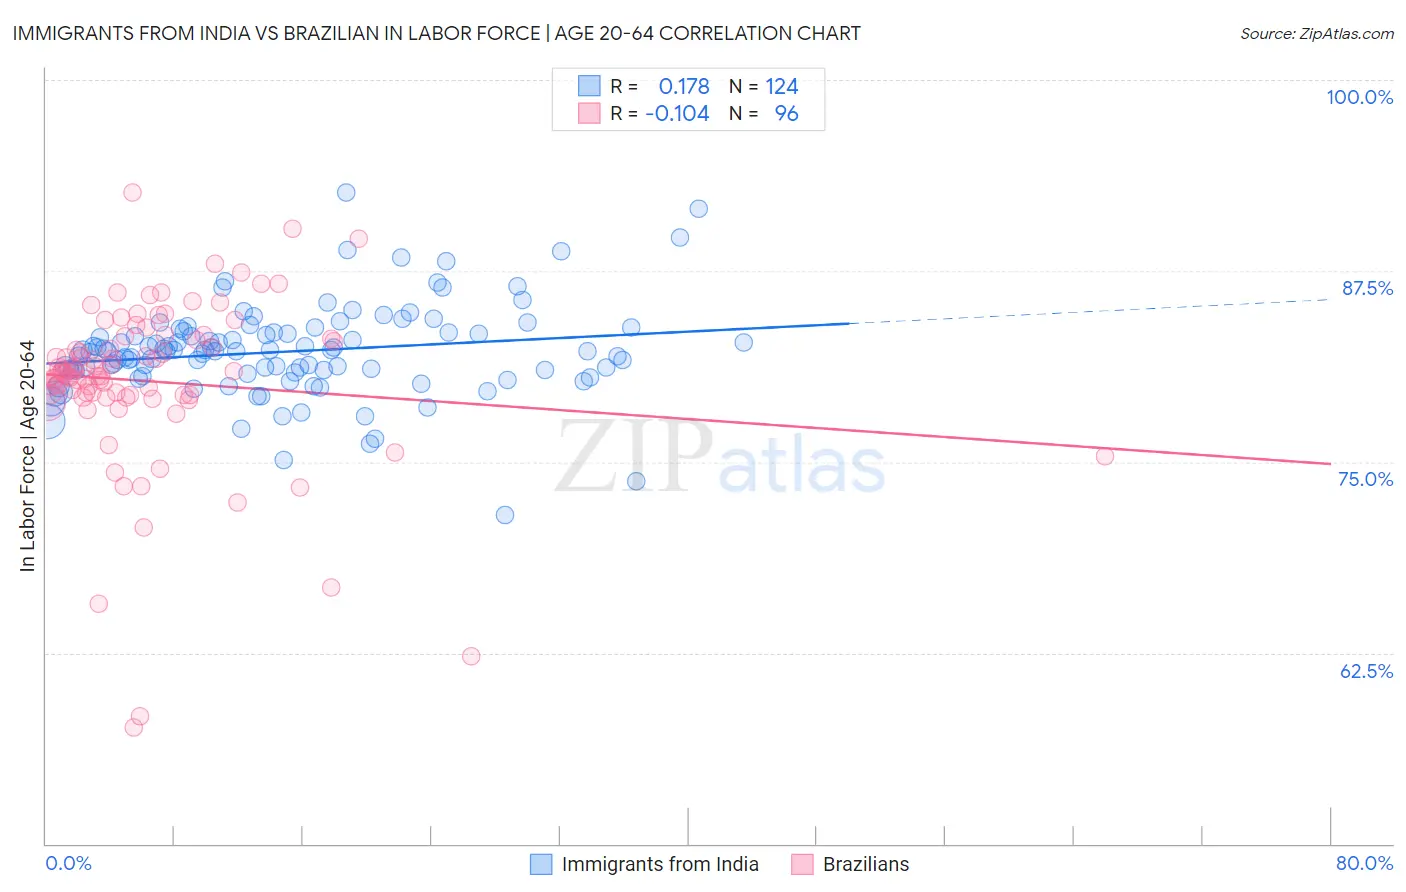
Immigrants from India vs Brazilian In Labor Force | Age 20-64 Correlation Chart
The statistical analysis conducted on geographies consisting of 434,133,401 people shows a poor positive correlation between the proportion of Immigrants from India and labor force participation rate among population between the ages 20 and 64 in the United States with a correlation coefficient (R) of 0.178 and weighted average of 81.3%. Similarly, the statistical analysis conducted on geographies consisting of 323,965,381 people shows a poor negative correlation between the proportion of Brazilians and labor force participation rate among population between the ages 20 and 64 in the United States with a correlation coefficient (R) of -0.104 and weighted average of 80.5%, a difference of 0.88%.
In Labor Force | Age 20-64 Correlation Summary
| Measurement | Immigrants from India | Brazilian |
| Minimum | 71.5% | 57.6% |
| Maximum | 92.6% | 92.6% |
| Range | 21.1% | 35.0% |
| Mean | 82.2% | 80.3% |
| Median | 82.3% | 80.8% |
| Interquartile 25% (IQ1) | 80.9% | 79.3% |
| Interquartile 75% (IQ3) | 83.5% | 83.2% |
| Interquartile Range (IQR) | 2.6% | 3.8% |
| Standard Deviation (Sample) | 3.1% | 5.7% |
| Standard Deviation (Population) | 3.1% | 5.7% |
Similar Demographics by In Labor Force | Age 20-64
Demographics Similar to Immigrants from India by In Labor Force | Age 20-64
In terms of in labor force | age 20-64, the demographic groups most similar to Immigrants from India are Immigrants from Eritrea (81.3%, a difference of 0.030%), Immigrants from Eastern Africa (81.3%, a difference of 0.060%), Cambodian (81.1%, a difference of 0.24%), Immigrants from Sierra Leone (81.5%, a difference of 0.25%), and Bulgarian (81.1%, a difference of 0.25%).
| Demographics | Rating | Rank | In Labor Force | Age 20-64 |
| Somalis | 100.0 /100 | #6 | Exceptional 81.6% |
| Immigrants | Cameroon | 100.0 /100 | #7 | Exceptional 81.6% |
| Immigrants | Somalia | 100.0 /100 | #8 | Exceptional 81.6% |
| Sierra Leoneans | 100.0 /100 | #9 | Exceptional 81.5% |
| Immigrants | Sierra Leone | 100.0 /100 | #10 | Exceptional 81.5% |
| Immigrants | Eastern Africa | 100.0 /100 | #11 | Exceptional 81.3% |
| Immigrants | Eritrea | 100.0 /100 | #12 | Exceptional 81.3% |
| Immigrants | India | 100.0 /100 | #13 | Exceptional 81.3% |
| Cambodians | 100.0 /100 | #14 | Exceptional 81.1% |
| Bulgarians | 100.0 /100 | #15 | Exceptional 81.1% |
| Immigrants | Nepal | 100.0 /100 | #16 | Exceptional 81.1% |
| Norwegians | 100.0 /100 | #17 | Exceptional 81.0% |
| Immigrants | Bulgaria | 100.0 /100 | #18 | Exceptional 81.0% |
| Zimbabweans | 100.0 /100 | #19 | Exceptional 81.0% |
| Thais | 100.0 /100 | #20 | Exceptional 80.9% |
Demographics Similar to Brazilians by In Labor Force | Age 20-64
In terms of in labor force | age 20-64, the demographic groups most similar to Brazilians are Immigrants from Zimbabwe (80.5%, a difference of 0.0%), Ugandan (80.6%, a difference of 0.010%), Immigrants from Liberia (80.5%, a difference of 0.020%), Paraguayan (80.6%, a difference of 0.030%), and Immigrants from Moldova (80.6%, a difference of 0.030%).
| Demographics | Rating | Rank | In Labor Force | Age 20-64 |
| Immigrants | Ireland | 99.9 /100 | #32 | Exceptional 80.7% |
| Chinese | 99.9 /100 | #33 | Exceptional 80.7% |
| Immigrants | Brazil | 99.9 /100 | #34 | Exceptional 80.7% |
| Immigrants | Poland | 99.9 /100 | #35 | Exceptional 80.6% |
| Paraguayans | 99.8 /100 | #36 | Exceptional 80.6% |
| Immigrants | Moldova | 99.8 /100 | #37 | Exceptional 80.6% |
| Ugandans | 99.8 /100 | #38 | Exceptional 80.6% |
| Brazilians | 99.8 /100 | #39 | Exceptional 80.5% |
| Immigrants | Zimbabwe | 99.8 /100 | #40 | Exceptional 80.5% |
| Immigrants | Liberia | 99.8 /100 | #41 | Exceptional 80.5% |
| Latvians | 99.8 /100 | #42 | Exceptional 80.5% |
| Czechs | 99.7 /100 | #43 | Exceptional 80.5% |
| Immigrants | Middle Africa | 99.7 /100 | #44 | Exceptional 80.5% |
| Slovenes | 99.7 /100 | #45 | Exceptional 80.5% |
| Immigrants | Pakistan | 99.6 /100 | #46 | Exceptional 80.5% |