Syrian vs Immigrants from Eastern Europe In Labor Force | Age 20-64
COMPARE
Syrian
Immigrants from Eastern Europe
In Labor Force | Age 20-64
In Labor Force | Age 20-64 Comparison
Syrians
Immigrants from Eastern Europe
79.6%
IN LABOR FORCE | AGE 20-64
50.0/ 100
METRIC RATING
174th/ 347
METRIC RANK
80.2%
IN LABOR FORCE | AGE 20-64
98.1/ 100
METRIC RATING
74th/ 347
METRIC RANK
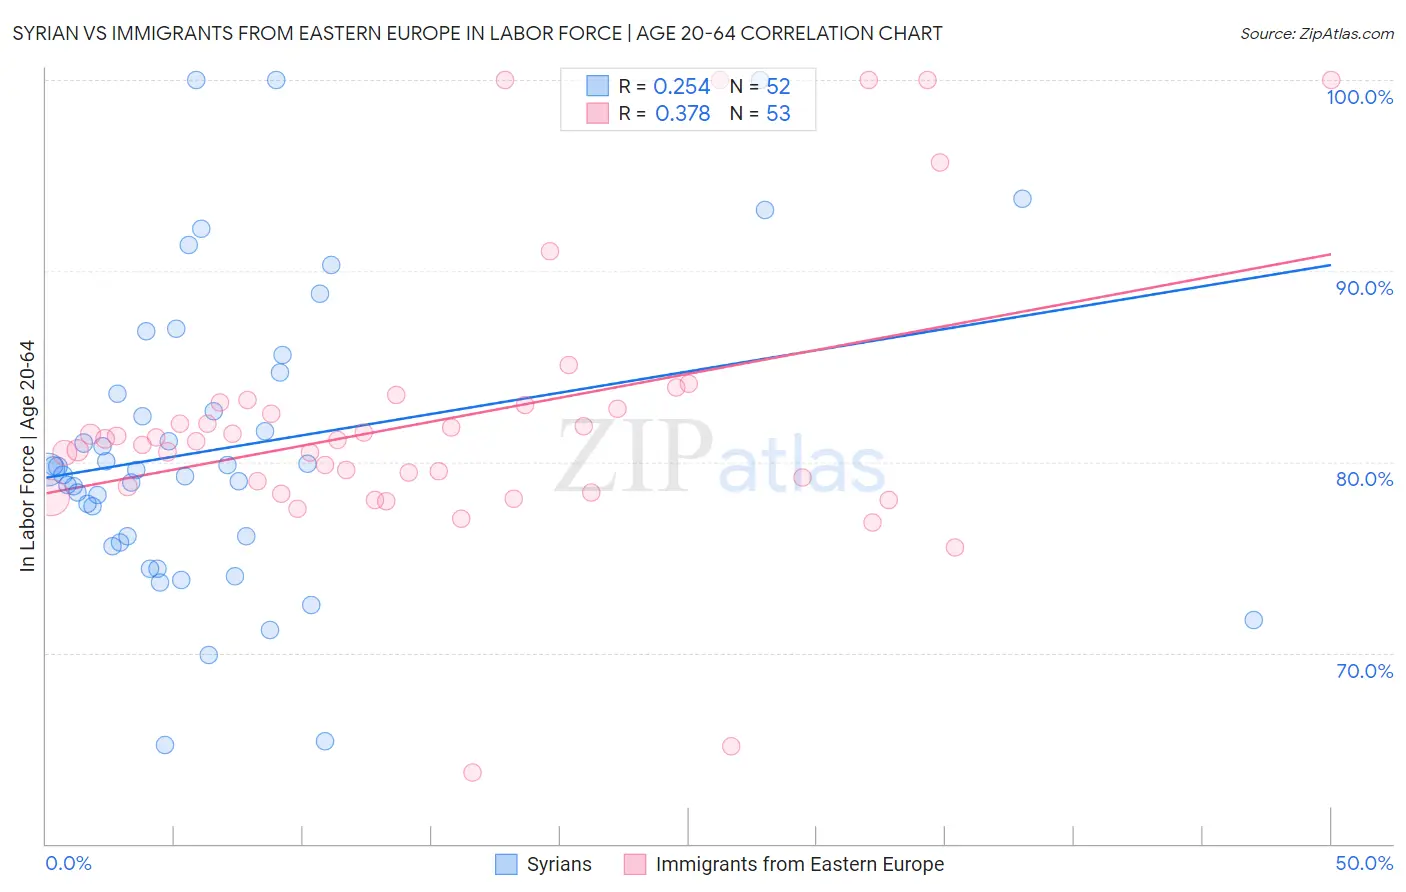
Syrian vs Immigrants from Eastern Europe In Labor Force | Age 20-64 Correlation Chart
The statistical analysis conducted on geographies consisting of 266,330,303 people shows a weak positive correlation between the proportion of Syrians and labor force participation rate among population between the ages 20 and 64 in the United States with a correlation coefficient (R) of 0.254 and weighted average of 79.6%. Similarly, the statistical analysis conducted on geographies consisting of 475,884,691 people shows a mild positive correlation between the proportion of Immigrants from Eastern Europe and labor force participation rate among population between the ages 20 and 64 in the United States with a correlation coefficient (R) of 0.378 and weighted average of 80.2%, a difference of 0.79%.
In Labor Force | Age 20-64 Correlation Summary
| Measurement | Syrian | Immigrants from Eastern Europe |
| Minimum | 65.2% | 63.7% |
| Maximum | 100.0% | 100.0% |
| Range | 34.8% | 36.3% |
| Mean | 80.8% | 82.2% |
| Median | 79.6% | 81.1% |
| Interquartile 25% (IQ1) | 75.9% | 78.6% |
| Interquartile 75% (IQ3) | 84.1% | 83.1% |
| Interquartile Range (IQR) | 8.2% | 4.5% |
| Standard Deviation (Sample) | 7.9% | 7.4% |
| Standard Deviation (Population) | 7.8% | 7.3% |
Similar Demographics by In Labor Force | Age 20-64
Demographics Similar to Syrians by In Labor Force | Age 20-64
In terms of in labor force | age 20-64, the demographic groups most similar to Syrians are Immigrants from Scotland (79.6%, a difference of 0.020%), Slavic (79.6%, a difference of 0.030%), Immigrants from Switzerland (79.6%, a difference of 0.030%), Immigrants from Belgium (79.6%, a difference of 0.030%), and Cuban (79.5%, a difference of 0.030%).
| Demographics | Rating | Rank | In Labor Force | Age 20-64 |
| Immigrants | Iraq | 62.0 /100 | #167 | Good 79.6% |
| Immigrants | Indonesia | 61.8 /100 | #168 | Good 79.6% |
| Laotians | 58.4 /100 | #169 | Average 79.6% |
| Slavs | 54.0 /100 | #170 | Average 79.6% |
| Immigrants | Switzerland | 53.3 /100 | #171 | Average 79.6% |
| Immigrants | Belgium | 53.1 /100 | #172 | Average 79.6% |
| Immigrants | Scotland | 52.4 /100 | #173 | Average 79.6% |
| Syrians | 50.0 /100 | #174 | Average 79.6% |
| Cubans | 46.1 /100 | #175 | Average 79.5% |
| Australians | 46.0 /100 | #176 | Average 79.5% |
| Immigrants | Netherlands | 45.2 /100 | #177 | Average 79.5% |
| Czechoslovakians | 44.3 /100 | #178 | Average 79.5% |
| Armenians | 41.4 /100 | #179 | Average 79.5% |
| Salvadorans | 41.0 /100 | #180 | Average 79.5% |
| Immigrants | Saudi Arabia | 37.7 /100 | #181 | Fair 79.5% |
Demographics Similar to Immigrants from Eastern Europe by In Labor Force | Age 20-64
In terms of in labor force | age 20-64, the demographic groups most similar to Immigrants from Eastern Europe are Cypriot (80.2%, a difference of 0.010%), Immigrants from Afghanistan (80.2%, a difference of 0.010%), Egyptian (80.2%, a difference of 0.030%), Immigrants from Colombia (80.2%, a difference of 0.030%), and Immigrants from Romania (80.2%, a difference of 0.030%).
| Demographics | Rating | Rank | In Labor Force | Age 20-64 |
| Taiwanese | 98.6 /100 | #67 | Exceptional 80.2% |
| Bhutanese | 98.6 /100 | #68 | Exceptional 80.2% |
| Albanians | 98.6 /100 | #69 | Exceptional 80.2% |
| Immigrants | Turkey | 98.5 /100 | #70 | Exceptional 80.2% |
| Soviet Union | 98.5 /100 | #71 | Exceptional 80.2% |
| Eastern Europeans | 98.4 /100 | #72 | Exceptional 80.2% |
| Cypriots | 98.2 /100 | #73 | Exceptional 80.2% |
| Immigrants | Eastern Europe | 98.1 /100 | #74 | Exceptional 80.2% |
| Immigrants | Afghanistan | 97.9 /100 | #75 | Exceptional 80.2% |
| Egyptians | 97.8 /100 | #76 | Exceptional 80.2% |
| Immigrants | Colombia | 97.8 /100 | #77 | Exceptional 80.2% |
| Immigrants | Romania | 97.8 /100 | #78 | Exceptional 80.2% |
| Asians | 97.7 /100 | #79 | Exceptional 80.2% |
| Immigrants | Croatia | 97.6 /100 | #80 | Exceptional 80.1% |
| German Russians | 97.3 /100 | #81 | Exceptional 80.1% |