Immigrants from India vs Immigrants from Eastern Europe Nursery School
COMPARE
Immigrants from India
Immigrants from Eastern Europe
Nursery School
Nursery School Comparison
Immigrants from India
Immigrants from Eastern Europe
98.3%
NURSERY SCHOOL
98.7/ 100
METRIC RATING
93rd/ 347
METRIC RANK
98.0%
NURSERY SCHOOL
59.7/ 100
METRIC RATING
161st/ 347
METRIC RANK
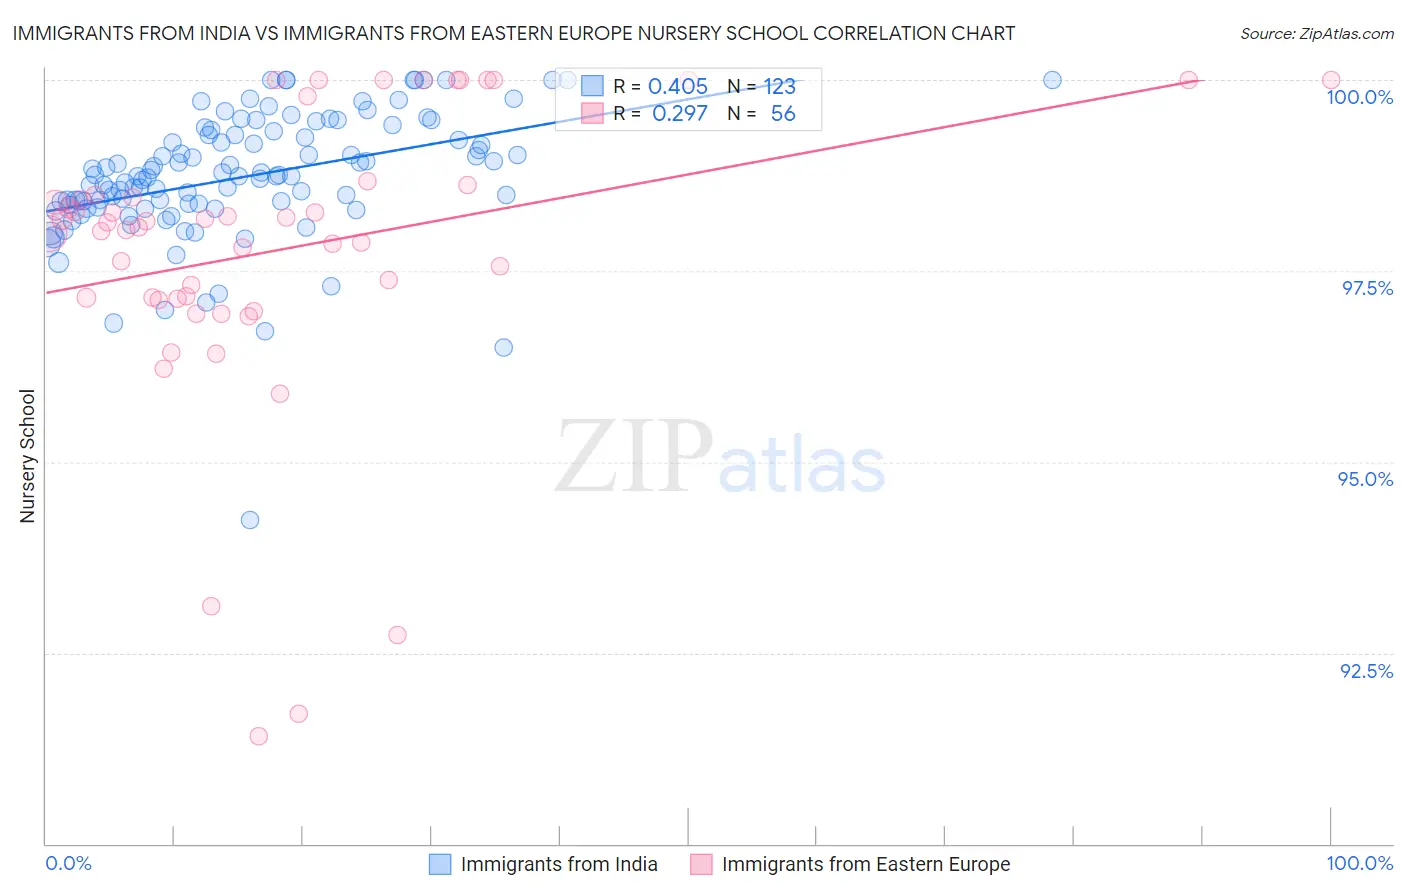
Immigrants from India vs Immigrants from Eastern Europe Nursery School Correlation Chart
The statistical analysis conducted on geographies consisting of 434,105,844 people shows a moderate positive correlation between the proportion of Immigrants from India and percentage of population with at least nursery school education in the United States with a correlation coefficient (R) of 0.405 and weighted average of 98.3%. Similarly, the statistical analysis conducted on geographies consisting of 475,879,420 people shows a weak positive correlation between the proportion of Immigrants from Eastern Europe and percentage of population with at least nursery school education in the United States with a correlation coefficient (R) of 0.297 and weighted average of 98.0%, a difference of 0.29%.
Nursery School Correlation Summary
| Measurement | Immigrants from India | Immigrants from Eastern Europe |
| Minimum | 94.2% | 91.4% |
| Maximum | 100.0% | 100.0% |
| Range | 5.8% | 8.6% |
| Mean | 98.7% | 97.8% |
| Median | 98.7% | 98.1% |
| Interquartile 25% (IQ1) | 98.4% | 97.1% |
| Interquartile 75% (IQ3) | 99.3% | 98.6% |
| Interquartile Range (IQR) | 0.92% | 1.4% |
| Standard Deviation (Sample) | 0.85% | 1.9% |
| Standard Deviation (Population) | 0.84% | 1.9% |
Similar Demographics by Nursery School
Demographics Similar to Immigrants from India by Nursery School
In terms of nursery school, the demographic groups most similar to Immigrants from India are Macedonian (98.3%, a difference of 0.0%), Hopi (98.3%, a difference of 0.010%), Ukrainian (98.3%, a difference of 0.010%), Immigrants from South Africa (98.3%, a difference of 0.010%), and Immigrants from Western Europe (98.3%, a difference of 0.010%).
| Demographics | Rating | Rank | Nursery School |
| Immigrants | Australia | 99.0 /100 | #86 | Exceptional 98.3% |
| Hopi | 98.9 /100 | #87 | Exceptional 98.3% |
| Ukrainians | 98.9 /100 | #88 | Exceptional 98.3% |
| Immigrants | South Africa | 98.8 /100 | #89 | Exceptional 98.3% |
| Immigrants | Western Europe | 98.8 /100 | #90 | Exceptional 98.3% |
| Zimbabweans | 98.8 /100 | #91 | Exceptional 98.3% |
| Macedonians | 98.7 /100 | #92 | Exceptional 98.3% |
| Immigrants | India | 98.7 /100 | #93 | Exceptional 98.3% |
| Immigrants | Germany | 98.6 /100 | #94 | Exceptional 98.3% |
| South Africans | 98.6 /100 | #95 | Exceptional 98.3% |
| Cypriots | 98.3 /100 | #96 | Exceptional 98.3% |
| Immigrants | Nonimmigrants | 98.3 /100 | #97 | Exceptional 98.3% |
| Choctaw | 98.3 /100 | #98 | Exceptional 98.3% |
| Colville | 98.2 /100 | #99 | Exceptional 98.3% |
| Puget Sound Salish | 98.0 /100 | #100 | Exceptional 98.3% |
Demographics Similar to Immigrants from Eastern Europe by Nursery School
In terms of nursery school, the demographic groups most similar to Immigrants from Eastern Europe are Immigrants from Russia (98.0%, a difference of 0.0%), Brazilian (98.0%, a difference of 0.0%), Immigrants from Italy (98.0%, a difference of 0.0%), French American Indian (98.0%, a difference of 0.010%), and Ugandan (98.0%, a difference of 0.010%).
| Demographics | Rating | Rank | Nursery School |
| Immigrants | Iran | 68.7 /100 | #154 | Good 98.0% |
| Immigrants | South Central Asia | 66.7 /100 | #155 | Good 98.0% |
| Venezuelans | 66.6 /100 | #156 | Good 98.0% |
| Comanche | 66.0 /100 | #157 | Good 98.0% |
| Immigrants | North Macedonia | 65.7 /100 | #158 | Good 98.0% |
| French American Indians | 62.1 /100 | #159 | Good 98.0% |
| Immigrants | Russia | 59.9 /100 | #160 | Average 98.0% |
| Immigrants | Eastern Europe | 59.7 /100 | #161 | Average 98.0% |
| Brazilians | 59.4 /100 | #162 | Average 98.0% |
| Immigrants | Italy | 59.0 /100 | #163 | Average 98.0% |
| Ugandans | 56.4 /100 | #164 | Average 98.0% |
| Chileans | 56.4 /100 | #165 | Average 98.0% |
| Spanish Americans | 55.6 /100 | #166 | Average 98.0% |
| Immigrants | Spain | 55.6 /100 | #167 | Average 98.0% |
| Immigrants | Micronesia | 55.0 /100 | #168 | Average 98.0% |