Immigrants from India vs Immigrants from Eastern Europe Single Mother Households
COMPARE
Immigrants from India
Immigrants from Eastern Europe
Single Mother Households
Single Mother Households Comparison
Immigrants from India
Immigrants from Eastern Europe
5.1%
SINGLE MOTHER HOUSEHOLDS
99.9/ 100
METRIC RATING
13th/ 347
METRIC RANK
5.6%
SINGLE MOTHER HOUSEHOLDS
98.4/ 100
METRIC RATING
70th/ 347
METRIC RANK
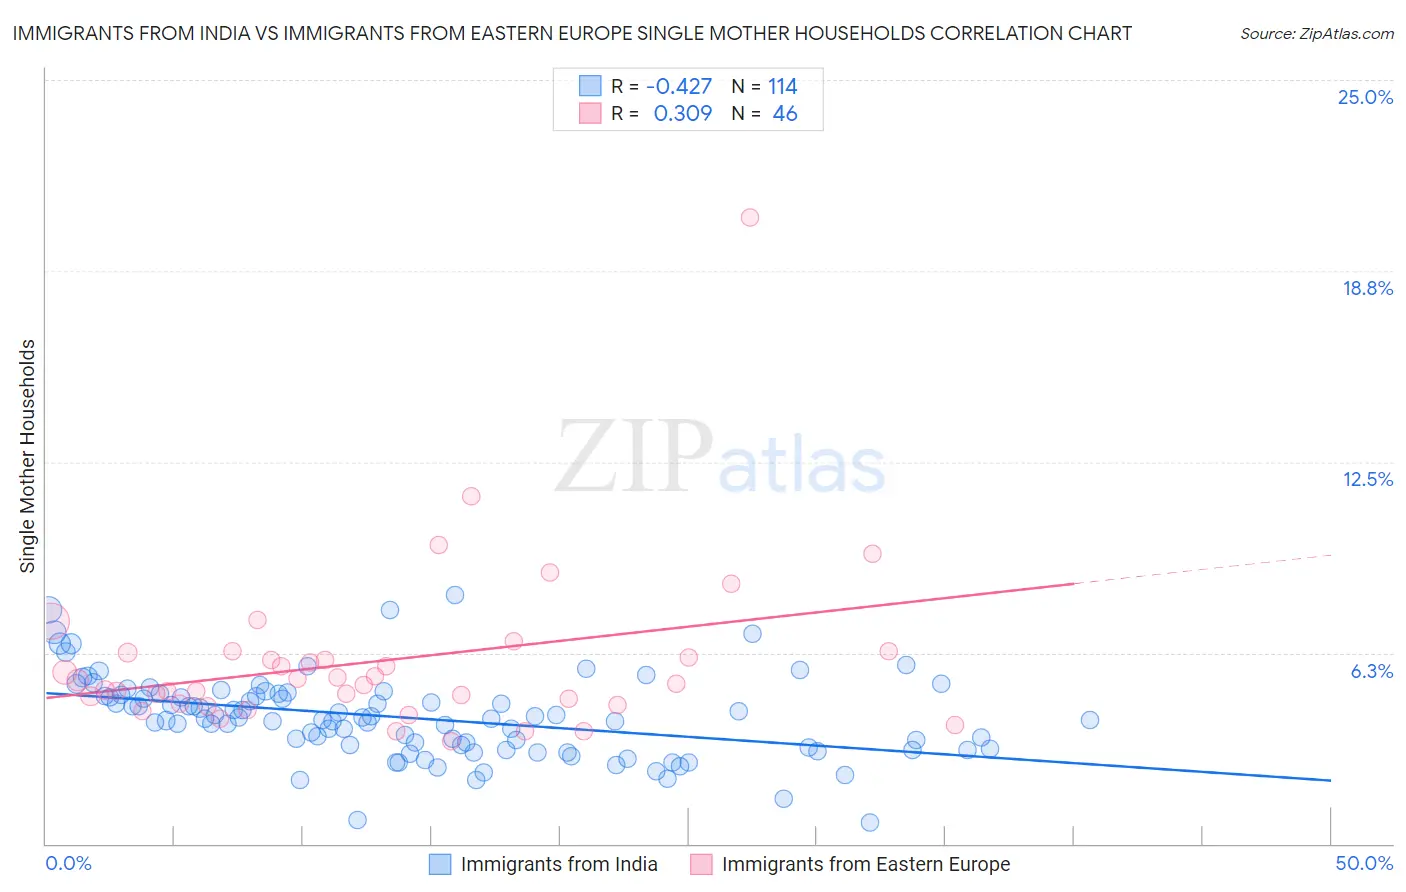
Immigrants from India vs Immigrants from Eastern Europe Single Mother Households Correlation Chart
The statistical analysis conducted on geographies consisting of 432,741,319 people shows a moderate negative correlation between the proportion of Immigrants from India and percentage of single mother households in the United States with a correlation coefficient (R) of -0.427 and weighted average of 5.1%. Similarly, the statistical analysis conducted on geographies consisting of 473,555,541 people shows a mild positive correlation between the proportion of Immigrants from Eastern Europe and percentage of single mother households in the United States with a correlation coefficient (R) of 0.309 and weighted average of 5.6%, a difference of 10.2%.
Single Mother Households Correlation Summary
| Measurement | Immigrants from India | Immigrants from Eastern Europe |
| Minimum | 0.68% | 3.3% |
| Maximum | 8.1% | 20.5% |
| Range | 7.5% | 17.1% |
| Mean | 4.1% | 6.0% |
| Median | 4.1% | 5.3% |
| Interquartile 25% (IQ1) | 3.2% | 4.6% |
| Interquartile 75% (IQ3) | 4.9% | 6.3% |
| Interquartile Range (IQR) | 1.7% | 1.7% |
| Standard Deviation (Sample) | 1.3% | 2.8% |
| Standard Deviation (Population) | 1.3% | 2.7% |
Similar Demographics by Single Mother Households
Demographics Similar to Immigrants from India by Single Mother Households
In terms of single mother households, the demographic groups most similar to Immigrants from India are Cypriot (5.1%, a difference of 0.12%), Immigrants from China (5.1%, a difference of 0.30%), Immigrants from Australia (5.1%, a difference of 0.32%), Immigrants from Eastern Asia (5.1%, a difference of 0.42%), and Indian (Asian) (5.1%, a difference of 0.60%).
| Demographics | Rating | Rank | Single Mother Households |
| Immigrants | Singapore | 100.0 /100 | #6 | Exceptional 5.0% |
| Iranians | 100.0 /100 | #7 | Exceptional 5.0% |
| Immigrants | Ireland | 99.9 /100 | #8 | Exceptional 5.0% |
| Okinawans | 99.9 /100 | #9 | Exceptional 5.0% |
| Immigrants | Israel | 99.9 /100 | #10 | Exceptional 5.0% |
| Immigrants | China | 99.9 /100 | #11 | Exceptional 5.1% |
| Cypriots | 99.9 /100 | #12 | Exceptional 5.1% |
| Immigrants | India | 99.9 /100 | #13 | Exceptional 5.1% |
| Immigrants | Australia | 99.9 /100 | #14 | Exceptional 5.1% |
| Immigrants | Eastern Asia | 99.9 /100 | #15 | Exceptional 5.1% |
| Indians (Asian) | 99.9 /100 | #16 | Exceptional 5.1% |
| Soviet Union | 99.9 /100 | #17 | Exceptional 5.1% |
| Immigrants | Armenia | 99.9 /100 | #18 | Exceptional 5.2% |
| Chinese | 99.9 /100 | #19 | Exceptional 5.2% |
| Maltese | 99.9 /100 | #20 | Exceptional 5.2% |
Demographics Similar to Immigrants from Eastern Europe by Single Mother Households
In terms of single mother households, the demographic groups most similar to Immigrants from Eastern Europe are Immigrants from Kazakhstan (5.6%, a difference of 0.010%), Asian (5.6%, a difference of 0.080%), Immigrants from Bulgaria (5.6%, a difference of 0.10%), Immigrants from Netherlands (5.6%, a difference of 0.10%), and Immigrants from Asia (5.6%, a difference of 0.16%).
| Demographics | Rating | Rank | Single Mother Households |
| Immigrants | North Macedonia | 98.6 /100 | #63 | Exceptional 5.6% |
| Immigrants | France | 98.6 /100 | #64 | Exceptional 5.6% |
| Greeks | 98.6 /100 | #65 | Exceptional 5.6% |
| Immigrants | Canada | 98.5 /100 | #66 | Exceptional 5.6% |
| Italians | 98.5 /100 | #67 | Exceptional 5.6% |
| Immigrants | Bulgaria | 98.5 /100 | #68 | Exceptional 5.6% |
| Asians | 98.5 /100 | #69 | Exceptional 5.6% |
| Immigrants | Eastern Europe | 98.4 /100 | #70 | Exceptional 5.6% |
| Immigrants | Kazakhstan | 98.4 /100 | #71 | Exceptional 5.6% |
| Immigrants | Netherlands | 98.4 /100 | #72 | Exceptional 5.6% |
| Immigrants | Asia | 98.4 /100 | #73 | Exceptional 5.6% |
| Immigrants | North America | 98.3 /100 | #74 | Exceptional 5.6% |
| Slovenes | 98.3 /100 | #75 | Exceptional 5.6% |
| New Zealanders | 98.2 /100 | #76 | Exceptional 5.6% |
| Romanians | 98.1 /100 | #77 | Exceptional 5.6% |