Immigrants from Hungary vs Immigrants from Eastern Europe In Labor Force | Age > 16
COMPARE
Immigrants from Hungary
Immigrants from Eastern Europe
In Labor Force | Age > 16
In Labor Force | Age > 16 Comparison
Immigrants from Hungary
Immigrants from Eastern Europe
64.5%
IN LABOR FORCE | AGE > 16
3.8/ 100
METRIC RATING
239th/ 347
METRIC RANK
65.4%
IN LABOR FORCE | AGE > 16
78.3/ 100
METRIC RATING
154th/ 347
METRIC RANK
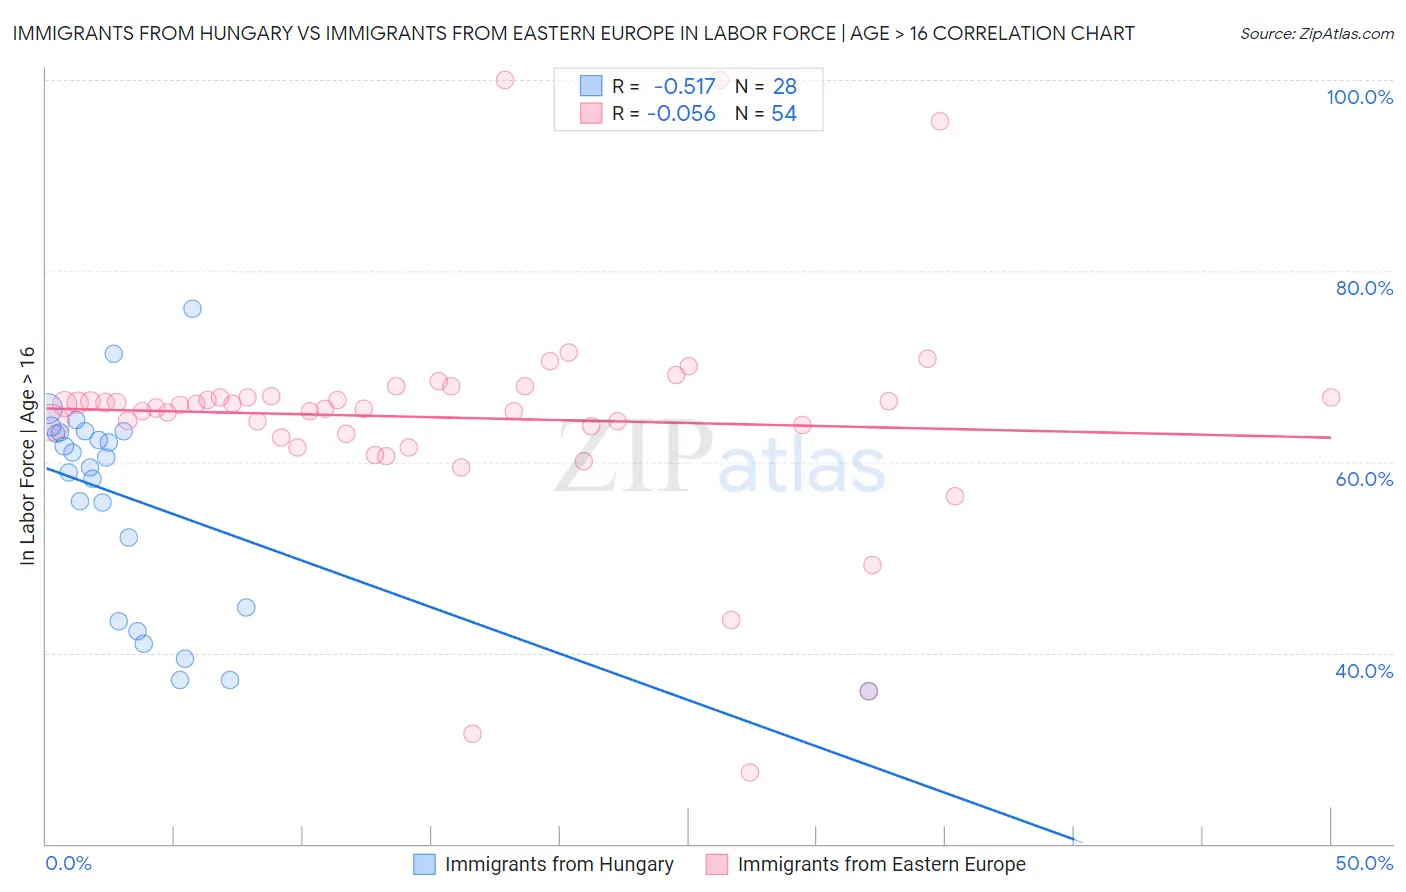
Immigrants from Hungary vs Immigrants from Eastern Europe In Labor Force | Age > 16 Correlation Chart
The statistical analysis conducted on geographies consisting of 195,708,395 people shows a substantial negative correlation between the proportion of Immigrants from Hungary and labor force participation rate among population ages 16 and over in the United States with a correlation coefficient (R) of -0.517 and weighted average of 64.5%. Similarly, the statistical analysis conducted on geographies consisting of 475,885,468 people shows a slight negative correlation between the proportion of Immigrants from Eastern Europe and labor force participation rate among population ages 16 and over in the United States with a correlation coefficient (R) of -0.056 and weighted average of 65.4%, a difference of 1.3%.
In Labor Force | Age > 16 Correlation Summary
| Measurement | Immigrants from Hungary | Immigrants from Eastern Europe |
| Minimum | 36.0% | 27.4% |
| Maximum | 76.0% | 100.0% |
| Range | 40.0% | 72.6% |
| Mean | 55.8% | 64.6% |
| Median | 60.0% | 65.8% |
| Interquartile 25% (IQ1) | 44.0% | 62.9% |
| Interquartile 75% (IQ3) | 63.1% | 66.7% |
| Interquartile Range (IQR) | 19.1% | 3.8% |
| Standard Deviation (Sample) | 11.1% | 12.2% |
| Standard Deviation (Population) | 10.9% | 12.1% |
Similar Demographics by In Labor Force | Age > 16
Demographics Similar to Immigrants from Hungary by In Labor Force | Age > 16
In terms of in labor force | age > 16, the demographic groups most similar to Immigrants from Hungary are Lebanese (64.5%, a difference of 0.010%), Immigrants from Bangladesh (64.5%, a difference of 0.020%), Immigrants from Dominica (64.5%, a difference of 0.020%), Immigrants from Netherlands (64.5%, a difference of 0.030%), and Immigrants from Lebanon (64.5%, a difference of 0.050%).
| Demographics | Rating | Rank | In Labor Force | Age > 16 |
| Africans | 5.8 /100 | #232 | Tragic 64.6% |
| Slavs | 4.9 /100 | #233 | Tragic 64.6% |
| Vietnamese | 4.7 /100 | #234 | Tragic 64.6% |
| Austrians | 4.6 /100 | #235 | Tragic 64.6% |
| Immigrants | Norway | 4.6 /100 | #236 | Tragic 64.6% |
| Italians | 4.6 /100 | #237 | Tragic 64.6% |
| Lebanese | 3.9 /100 | #238 | Tragic 64.5% |
| Immigrants | Hungary | 3.8 /100 | #239 | Tragic 64.5% |
| Immigrants | Bangladesh | 3.6 /100 | #240 | Tragic 64.5% |
| Immigrants | Dominica | 3.5 /100 | #241 | Tragic 64.5% |
| Immigrants | Netherlands | 3.4 /100 | #242 | Tragic 64.5% |
| Immigrants | Lebanon | 3.2 /100 | #243 | Tragic 64.5% |
| Tsimshian | 3.1 /100 | #244 | Tragic 64.5% |
| West Indians | 3.0 /100 | #245 | Tragic 64.5% |
| Immigrants | Caribbean | 2.3 /100 | #246 | Tragic 64.4% |
Demographics Similar to Immigrants from Eastern Europe by In Labor Force | Age > 16
In terms of in labor force | age > 16, the demographic groups most similar to Immigrants from Eastern Europe are Immigrants from Armenia (65.3%, a difference of 0.030%), Immigrants from China (65.4%, a difference of 0.040%), Immigrants from Ireland (65.3%, a difference of 0.040%), Immigrants from Russia (65.3%, a difference of 0.040%), and Yugoslavian (65.4%, a difference of 0.050%).
| Demographics | Rating | Rank | In Labor Force | Age > 16 |
| Immigrants | Oceania | 87.5 /100 | #147 | Excellent 65.5% |
| Bhutanese | 86.3 /100 | #148 | Excellent 65.5% |
| Immigrants | Albania | 85.7 /100 | #149 | Excellent 65.4% |
| Immigrants | Immigrants | 81.9 /100 | #150 | Excellent 65.4% |
| Czechs | 81.5 /100 | #151 | Excellent 65.4% |
| Yugoslavians | 81.3 /100 | #152 | Excellent 65.4% |
| Immigrants | China | 80.5 /100 | #153 | Excellent 65.4% |
| Immigrants | Eastern Europe | 78.3 /100 | #154 | Good 65.4% |
| Immigrants | Armenia | 76.6 /100 | #155 | Good 65.3% |
| Immigrants | Ireland | 75.9 /100 | #156 | Good 65.3% |
| Immigrants | Russia | 75.7 /100 | #157 | Good 65.3% |
| Panamanians | 75.2 /100 | #158 | Good 65.3% |
| Immigrants | Syria | 74.6 /100 | #159 | Good 65.3% |
| Immigrants | South Africa | 73.5 /100 | #160 | Good 65.3% |
| Australians | 71.3 /100 | #161 | Good 65.3% |