Immigrants from Haiti vs Immigrants from Indonesia In Labor Force | Age 20-64
COMPARE
Immigrants from Haiti
Immigrants from Indonesia
In Labor Force | Age 20-64
In Labor Force | Age 20-64 Comparison
Immigrants from Haiti
Immigrants from Indonesia
79.4%
IN LABOR FORCE | AGE 20-64
32.1/ 100
METRIC RATING
188th/ 347
METRIC RANK
79.6%
IN LABOR FORCE | AGE 20-64
61.8/ 100
METRIC RATING
168th/ 347
METRIC RANK
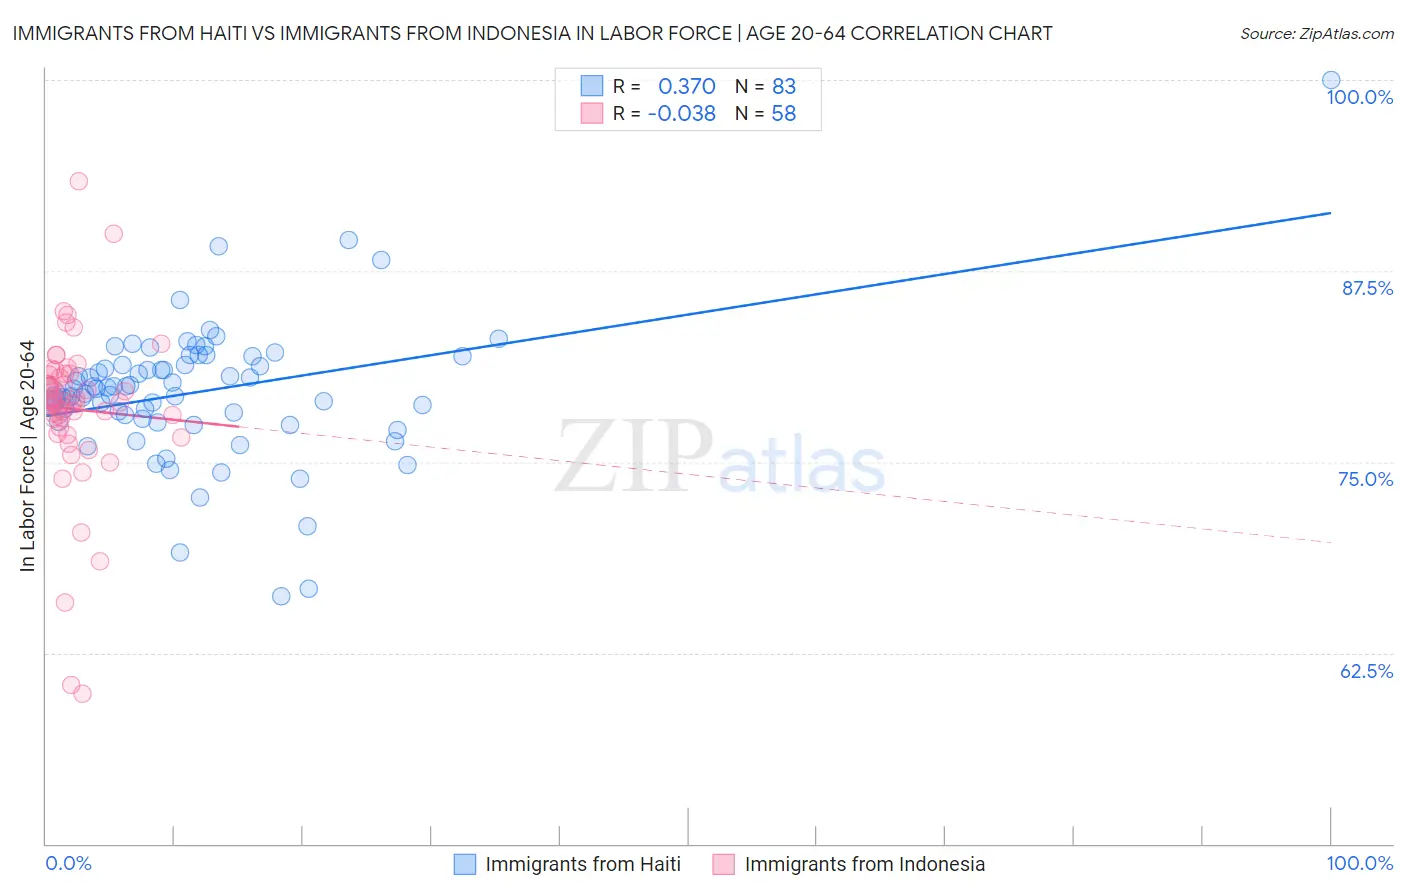
Immigrants from Haiti vs Immigrants from Indonesia In Labor Force | Age 20-64 Correlation Chart
The statistical analysis conducted on geographies consisting of 225,284,201 people shows a mild positive correlation between the proportion of Immigrants from Haiti and labor force participation rate among population between the ages 20 and 64 in the United States with a correlation coefficient (R) of 0.370 and weighted average of 79.4%. Similarly, the statistical analysis conducted on geographies consisting of 215,788,587 people shows no correlation between the proportion of Immigrants from Indonesia and labor force participation rate among population between the ages 20 and 64 in the United States with a correlation coefficient (R) of -0.038 and weighted average of 79.6%, a difference of 0.25%.
In Labor Force | Age 20-64 Correlation Summary
| Measurement | Immigrants from Haiti | Immigrants from Indonesia |
| Minimum | 66.2% | 59.8% |
| Maximum | 100.0% | 93.4% |
| Range | 33.8% | 33.6% |
| Mean | 79.6% | 78.4% |
| Median | 79.8% | 78.9% |
| Interquartile 25% (IQ1) | 77.8% | 77.2% |
| Interquartile 75% (IQ3) | 81.4% | 80.8% |
| Interquartile Range (IQR) | 3.5% | 3.6% |
| Standard Deviation (Sample) | 4.5% | 5.4% |
| Standard Deviation (Population) | 4.5% | 5.4% |
Demographics Similar to Immigrants from Haiti and Immigrants from Indonesia by In Labor Force | Age 20-64
In terms of in labor force | age 20-64, the demographic groups most similar to Immigrants from Haiti are Assyrian/Chaldean/Syriac (79.4%, a difference of 0.010%), Israeli (79.5%, a difference of 0.020%), Northern European (79.5%, a difference of 0.020%), Finnish (79.5%, a difference of 0.030%), and Malaysian (79.5%, a difference of 0.040%). Similarly, the demographic groups most similar to Immigrants from Indonesia are Laotian (79.6%, a difference of 0.030%), Slavic (79.6%, a difference of 0.070%), Immigrants from Switzerland (79.6%, a difference of 0.070%), Immigrants from Belgium (79.6%, a difference of 0.070%), and Immigrants from Scotland (79.6%, a difference of 0.080%).
| Demographics | Rating | Rank | In Labor Force | Age 20-64 |
| Immigrants | Indonesia | 61.8 /100 | #168 | Good 79.6% |
| Laotians | 58.4 /100 | #169 | Average 79.6% |
| Slavs | 54.0 /100 | #170 | Average 79.6% |
| Immigrants | Switzerland | 53.3 /100 | #171 | Average 79.6% |
| Immigrants | Belgium | 53.1 /100 | #172 | Average 79.6% |
| Immigrants | Scotland | 52.4 /100 | #173 | Average 79.6% |
| Syrians | 50.0 /100 | #174 | Average 79.6% |
| Cubans | 46.1 /100 | #175 | Average 79.5% |
| Australians | 46.0 /100 | #176 | Average 79.5% |
| Immigrants | Netherlands | 45.2 /100 | #177 | Average 79.5% |
| Czechoslovakians | 44.3 /100 | #178 | Average 79.5% |
| Armenians | 41.4 /100 | #179 | Average 79.5% |
| Salvadorans | 41.0 /100 | #180 | Average 79.5% |
| Immigrants | Saudi Arabia | 37.7 /100 | #181 | Fair 79.5% |
| Malaysians | 37.1 /100 | #182 | Fair 79.5% |
| Immigrants | Hungary | 36.8 /100 | #183 | Fair 79.5% |
| Finns | 35.9 /100 | #184 | Fair 79.5% |
| Israelis | 34.7 /100 | #185 | Fair 79.5% |
| Northern Europeans | 34.5 /100 | #186 | Fair 79.5% |
| Assyrians/Chaldeans/Syriacs | 33.3 /100 | #187 | Fair 79.4% |
| Immigrants | Haiti | 32.1 /100 | #188 | Fair 79.4% |