Immigrants from Haiti vs Immigrants from North Macedonia Family Households with Children
COMPARE
Immigrants from Haiti
Immigrants from North Macedonia
Family Households with Children
Family Households with Children Comparison
Immigrants from Haiti
Immigrants from North Macedonia
27.2%
FAMILY HOUSEHOLDS WITH CHILDREN
20.3/ 100
METRIC RATING
205th/ 347
METRIC RANK
26.7%
FAMILY HOUSEHOLDS WITH CHILDREN
1.0/ 100
METRIC RATING
263rd/ 347
METRIC RANK
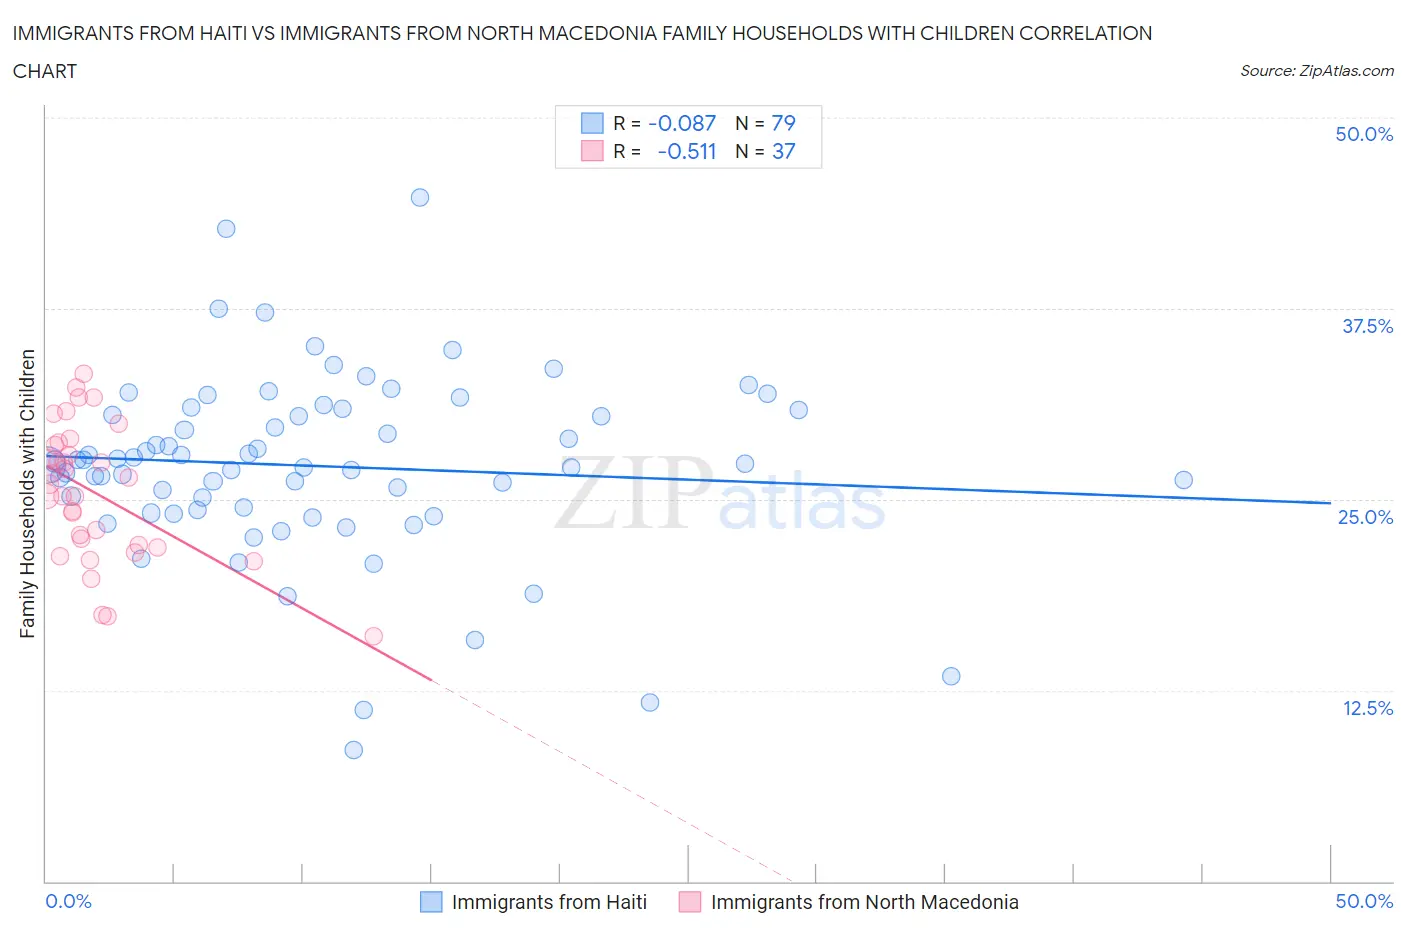
Immigrants from Haiti vs Immigrants from North Macedonia Family Households with Children Correlation Chart
The statistical analysis conducted on geographies consisting of 225,126,252 people shows a slight negative correlation between the proportion of Immigrants from Haiti and percentage of family households with children in the United States with a correlation coefficient (R) of -0.087 and weighted average of 27.2%. Similarly, the statistical analysis conducted on geographies consisting of 74,300,387 people shows a substantial negative correlation between the proportion of Immigrants from North Macedonia and percentage of family households with children in the United States with a correlation coefficient (R) of -0.511 and weighted average of 26.7%, a difference of 1.8%.
Family Households with Children Correlation Summary
| Measurement | Immigrants from Haiti | Immigrants from North Macedonia |
| Minimum | 8.6% | 16.1% |
| Maximum | 44.8% | 33.3% |
| Range | 36.2% | 17.2% |
| Mean | 27.2% | 25.5% |
| Median | 27.4% | 26.0% |
| Interquartile 25% (IQ1) | 24.3% | 22.0% |
| Interquartile 75% (IQ3) | 30.9% | 28.6% |
| Interquartile Range (IQR) | 6.6% | 6.7% |
| Standard Deviation (Sample) | 6.1% | 4.4% |
| Standard Deviation (Population) | 6.0% | 4.3% |
Similar Demographics by Family Households with Children
Demographics Similar to Immigrants from Haiti by Family Households with Children
In terms of family households with children, the demographic groups most similar to Immigrants from Haiti are Immigrants from Micronesia (27.2%, a difference of 0.0%), Haitian (27.2%, a difference of 0.020%), Immigrants from Sudan (27.3%, a difference of 0.050%), Kiowa (27.3%, a difference of 0.070%), and American (27.3%, a difference of 0.080%).
| Demographics | Rating | Rank | Family Households with Children |
| Immigrants | Romania | 34.4 /100 | #198 | Fair 27.4% |
| English | 32.0 /100 | #199 | Fair 27.3% |
| Immigrants | Congo | 28.7 /100 | #200 | Fair 27.3% |
| Bhutanese | 25.1 /100 | #201 | Fair 27.3% |
| Americans | 22.8 /100 | #202 | Fair 27.3% |
| Kiowa | 22.2 /100 | #203 | Fair 27.3% |
| Immigrants | Sudan | 21.6 /100 | #204 | Fair 27.3% |
| Immigrants | Haiti | 20.3 /100 | #205 | Fair 27.2% |
| Immigrants | Micronesia | 20.2 /100 | #206 | Fair 27.2% |
| Haitians | 19.8 /100 | #207 | Poor 27.2% |
| Immigrants | Poland | 16.4 /100 | #208 | Poor 27.2% |
| Dutch West Indians | 15.8 /100 | #209 | Poor 27.2% |
| Immigrants | Ukraine | 14.4 /100 | #210 | Poor 27.2% |
| Welsh | 14.2 /100 | #211 | Poor 27.2% |
| Immigrants | Dominica | 13.9 /100 | #212 | Poor 27.2% |
Demographics Similar to Immigrants from North Macedonia by Family Households with Children
In terms of family households with children, the demographic groups most similar to Immigrants from North Macedonia are Immigrants from Russia (26.8%, a difference of 0.0%), Taiwanese (26.7%, a difference of 0.030%), Chippewa (26.7%, a difference of 0.040%), Maltese (26.7%, a difference of 0.050%), and Immigrants from Uzbekistan (26.7%, a difference of 0.050%).
| Demographics | Rating | Rank | Family Households with Children |
| Scotch-Irish | 1.4 /100 | #256 | Tragic 26.8% |
| Slavs | 1.3 /100 | #257 | Tragic 26.8% |
| Immigrants | Cuba | 1.3 /100 | #258 | Tragic 26.8% |
| Immigrants | Lithuania | 1.2 /100 | #259 | Tragic 26.8% |
| Immigrants | Jamaica | 1.2 /100 | #260 | Tragic 26.8% |
| Immigrants | Belarus | 1.1 /100 | #261 | Tragic 26.8% |
| Immigrants | Russia | 1.0 /100 | #262 | Tragic 26.8% |
| Immigrants | North Macedonia | 1.0 /100 | #263 | Tragic 26.7% |
| Taiwanese | 0.9 /100 | #264 | Tragic 26.7% |
| Chippewa | 0.9 /100 | #265 | Tragic 26.7% |
| Maltese | 0.9 /100 | #266 | Tragic 26.7% |
| Immigrants | Uzbekistan | 0.9 /100 | #267 | Tragic 26.7% |
| Immigrants | Belgium | 0.9 /100 | #268 | Tragic 26.7% |
| Immigrants | Denmark | 0.8 /100 | #269 | Tragic 26.7% |
| Immigrants | Zaire | 0.7 /100 | #270 | Tragic 26.7% |