Immigrants from Haiti vs Fijian In Labor Force | Age 45-54
COMPARE
Immigrants from Haiti
Fijian
In Labor Force | Age 45-54
In Labor Force | Age 45-54 Comparison
Immigrants from Haiti
Fijians
83.0%
IN LABOR FORCE | AGE 45-54
77.9/ 100
METRIC RATING
141st/ 347
METRIC RANK
80.2%
IN LABOR FORCE | AGE 45-54
0.0/ 100
METRIC RATING
300th/ 347
METRIC RANK
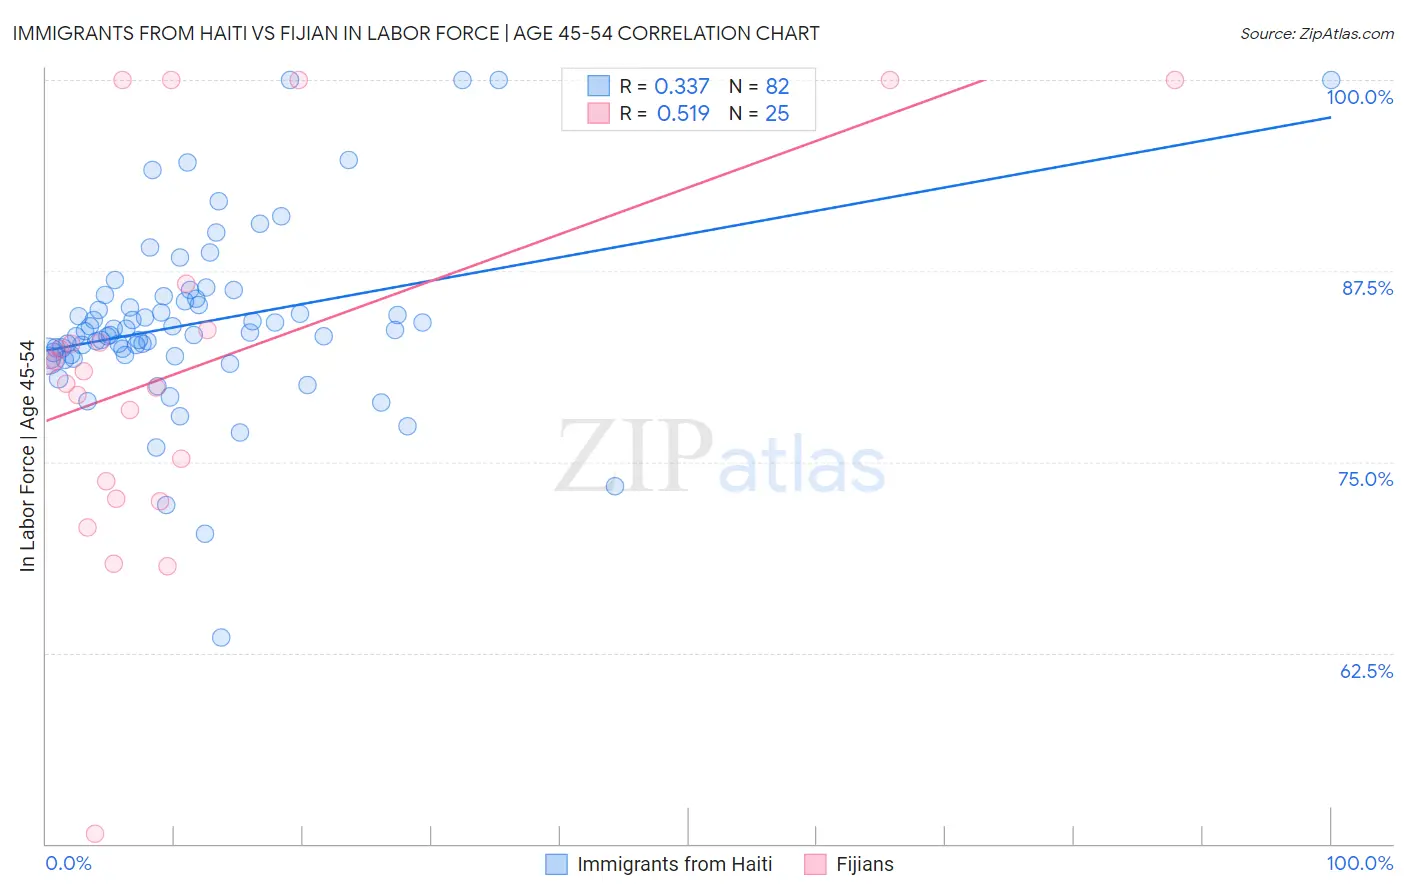
Immigrants from Haiti vs Fijian In Labor Force | Age 45-54 Correlation Chart
The statistical analysis conducted on geographies consisting of 225,182,151 people shows a mild positive correlation between the proportion of Immigrants from Haiti and labor force participation rate among population between the ages 45 and 54 in the United States with a correlation coefficient (R) of 0.337 and weighted average of 83.0%. Similarly, the statistical analysis conducted on geographies consisting of 55,946,141 people shows a substantial positive correlation between the proportion of Fijians and labor force participation rate among population between the ages 45 and 54 in the United States with a correlation coefficient (R) of 0.519 and weighted average of 80.2%, a difference of 3.4%.
In Labor Force | Age 45-54 Correlation Summary
| Measurement | Immigrants from Haiti | Fijian |
| Minimum | 63.5% | 50.7% |
| Maximum | 100.0% | 100.0% |
| Range | 36.5% | 49.3% |
| Mean | 84.1% | 81.3% |
| Median | 83.5% | 80.9% |
| Interquartile 25% (IQ1) | 82.0% | 73.2% |
| Interquartile 75% (IQ3) | 85.7% | 85.2% |
| Interquartile Range (IQR) | 3.7% | 12.0% |
| Standard Deviation (Sample) | 6.0% | 12.0% |
| Standard Deviation (Population) | 5.9% | 11.7% |
Similar Demographics by In Labor Force | Age 45-54
Demographics Similar to Immigrants from Haiti by In Labor Force | Age 45-54
In terms of in labor force | age 45-54, the demographic groups most similar to Immigrants from Haiti are Immigrants from Scotland (83.0%, a difference of 0.0%), Scandinavian (83.0%, a difference of 0.010%), Yugoslavian (83.0%, a difference of 0.010%), Okinawan (83.0%, a difference of 0.010%), and Soviet Union (83.0%, a difference of 0.010%).
| Demographics | Rating | Rank | In Labor Force | Age 45-54 |
| Sudanese | 82.0 /100 | #134 | Excellent 83.0% |
| Austrians | 81.3 /100 | #135 | Excellent 83.0% |
| Immigrants | Kazakhstan | 81.0 /100 | #136 | Excellent 83.0% |
| Immigrants | Spain | 80.4 /100 | #137 | Excellent 83.0% |
| Ghanaians | 79.5 /100 | #138 | Good 83.0% |
| Scandinavians | 78.5 /100 | #139 | Good 83.0% |
| Yugoslavians | 78.3 /100 | #140 | Good 83.0% |
| Immigrants | Haiti | 77.9 /100 | #141 | Good 83.0% |
| Immigrants | Scotland | 77.8 /100 | #142 | Good 83.0% |
| Okinawans | 77.0 /100 | #143 | Good 83.0% |
| Soviet Union | 76.8 /100 | #144 | Good 83.0% |
| Romanians | 75.4 /100 | #145 | Good 83.0% |
| Immigrants | France | 75.3 /100 | #146 | Good 83.0% |
| Czechoslovakians | 74.8 /100 | #147 | Good 83.0% |
| Immigrants | Nigeria | 74.1 /100 | #148 | Good 83.0% |
Demographics Similar to Fijians by In Labor Force | Age 45-54
In terms of in labor force | age 45-54, the demographic groups most similar to Fijians are Dominican (80.3%, a difference of 0.0%), Spanish American Indian (80.2%, a difference of 0.010%), Immigrants from Central America (80.2%, a difference of 0.090%), Marshallese (80.3%, a difference of 0.11%), and American (80.4%, a difference of 0.15%).
| Demographics | Rating | Rank | In Labor Force | Age 45-54 |
| Osage | 0.0 /100 | #293 | Tragic 80.6% |
| Yakama | 0.0 /100 | #294 | Tragic 80.6% |
| Nepalese | 0.0 /100 | #295 | Tragic 80.5% |
| Africans | 0.0 /100 | #296 | Tragic 80.5% |
| Americans | 0.0 /100 | #297 | Tragic 80.4% |
| Marshallese | 0.0 /100 | #298 | Tragic 80.3% |
| Dominicans | 0.0 /100 | #299 | Tragic 80.3% |
| Fijians | 0.0 /100 | #300 | Tragic 80.2% |
| Spanish American Indians | 0.0 /100 | #301 | Tragic 80.2% |
| Immigrants | Central America | 0.0 /100 | #302 | Tragic 80.2% |
| Immigrants | Azores | 0.0 /100 | #303 | Tragic 80.1% |
| Hispanics or Latinos | 0.0 /100 | #304 | Tragic 80.1% |
| Immigrants | Dominican Republic | 0.0 /100 | #305 | Tragic 80.1% |
| Spanish Americans | 0.0 /100 | #306 | Tragic 80.1% |
| Blackfeet | 0.0 /100 | #307 | Tragic 80.0% |