Immigrants from Grenada vs Egyptian In Labor Force | Age 25-29
COMPARE
Immigrants from Grenada
Egyptian
In Labor Force | Age 25-29
In Labor Force | Age 25-29 Comparison
Immigrants from Grenada
Egyptians
82.8%
IN LABOR FORCE | AGE 25-29
0.0/ 100
METRIC RATING
303rd/ 347
METRIC RANK
85.1%
IN LABOR FORCE | AGE 25-29
93.8/ 100
METRIC RATING
101st/ 347
METRIC RANK
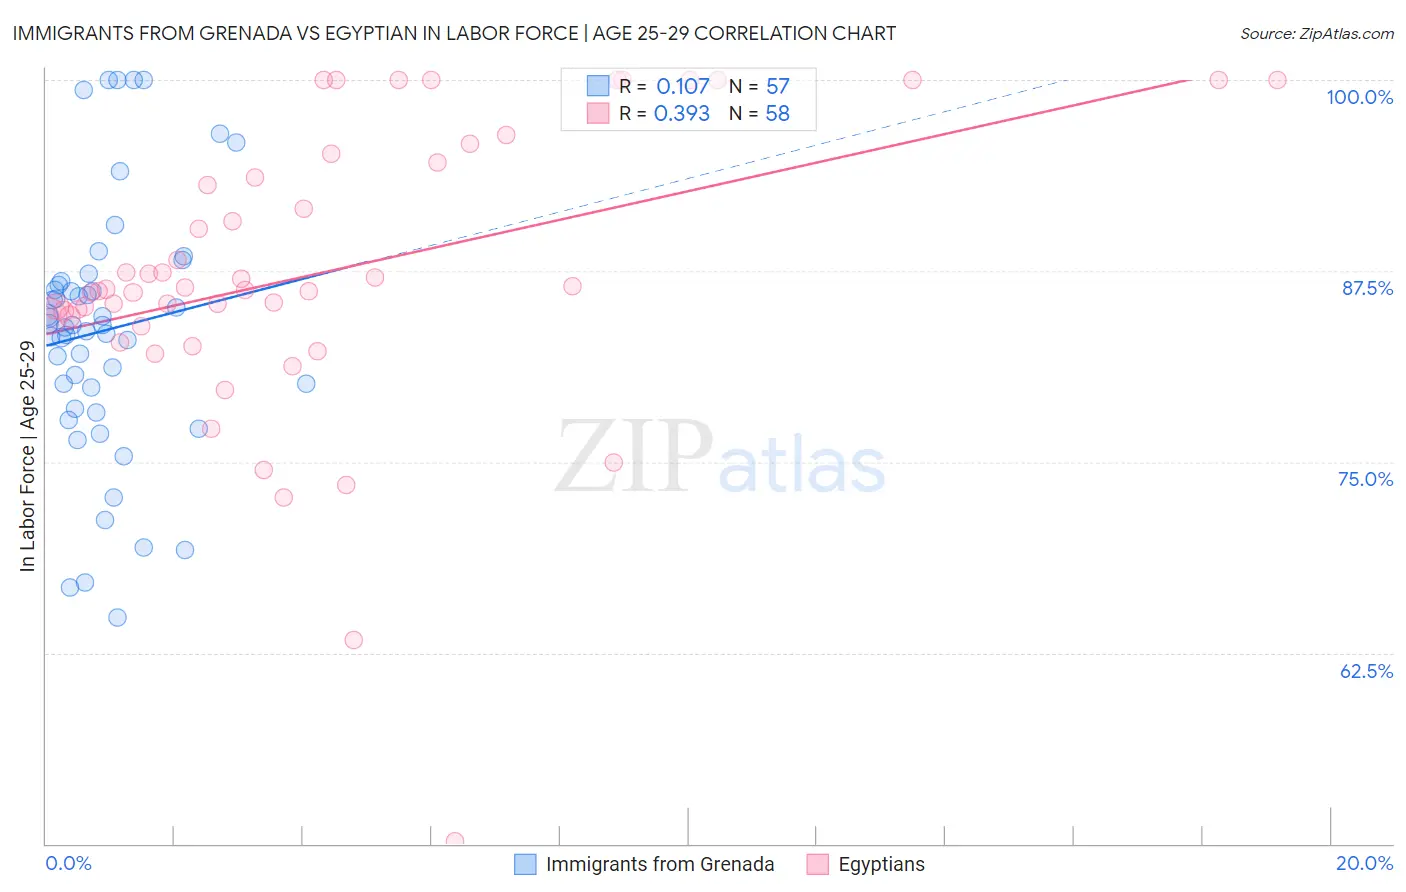
Immigrants from Grenada vs Egyptian In Labor Force | Age 25-29 Correlation Chart
The statistical analysis conducted on geographies consisting of 67,199,109 people shows a poor positive correlation between the proportion of Immigrants from Grenada and labor force participation rate among population between the ages 25 and 29 in the United States with a correlation coefficient (R) of 0.107 and weighted average of 82.8%. Similarly, the statistical analysis conducted on geographies consisting of 276,865,040 people shows a mild positive correlation between the proportion of Egyptians and labor force participation rate among population between the ages 25 and 29 in the United States with a correlation coefficient (R) of 0.393 and weighted average of 85.1%, a difference of 2.8%.
In Labor Force | Age 25-29 Correlation Summary
| Measurement | Immigrants from Grenada | Egyptian |
| Minimum | 64.8% | 50.2% |
| Maximum | 100.0% | 100.0% |
| Range | 35.2% | 49.8% |
| Mean | 83.6% | 87.4% |
| Median | 84.0% | 86.3% |
| Interquartile 25% (IQ1) | 79.2% | 84.5% |
| Interquartile 75% (IQ3) | 86.7% | 94.6% |
| Interquartile Range (IQR) | 7.6% | 10.1% |
| Standard Deviation (Sample) | 8.3% | 9.5% |
| Standard Deviation (Population) | 8.3% | 9.5% |
Similar Demographics by In Labor Force | Age 25-29
Demographics Similar to Immigrants from Grenada by In Labor Force | Age 25-29
In terms of in labor force | age 25-29, the demographic groups most similar to Immigrants from Grenada are Immigrants from Belize (82.8%, a difference of 0.010%), Vietnamese (82.8%, a difference of 0.050%), Spanish American Indian (82.9%, a difference of 0.11%), Fijian (82.9%, a difference of 0.12%), and Immigrants from St. Vincent and the Grenadines (82.7%, a difference of 0.12%).
| Demographics | Rating | Rank | In Labor Force | Age 25-29 |
| Immigrants | Nicaragua | 0.0 /100 | #296 | Tragic 82.9% |
| Potawatomi | 0.0 /100 | #297 | Tragic 82.9% |
| Native Hawaiians | 0.0 /100 | #298 | Tragic 82.9% |
| Fijians | 0.0 /100 | #299 | Tragic 82.9% |
| Spanish American Indians | 0.0 /100 | #300 | Tragic 82.9% |
| Vietnamese | 0.0 /100 | #301 | Tragic 82.8% |
| Immigrants | Belize | 0.0 /100 | #302 | Tragic 82.8% |
| Immigrants | Grenada | 0.0 /100 | #303 | Tragic 82.8% |
| Immigrants | St. Vincent and the Grenadines | 0.0 /100 | #304 | Tragic 82.7% |
| Blacks/African Americans | 0.0 /100 | #305 | Tragic 82.6% |
| Blackfeet | 0.0 /100 | #306 | Tragic 82.6% |
| Cajuns | 0.0 /100 | #307 | Tragic 82.5% |
| Central American Indians | 0.0 /100 | #308 | Tragic 82.4% |
| Immigrants | Central America | 0.0 /100 | #309 | Tragic 82.4% |
| Osage | 0.0 /100 | #310 | Tragic 82.3% |
Demographics Similar to Egyptians by In Labor Force | Age 25-29
In terms of in labor force | age 25-29, the demographic groups most similar to Egyptians are Immigrants from Switzerland (85.1%, a difference of 0.0%), Slavic (85.1%, a difference of 0.0%), Mongolian (85.1%, a difference of 0.010%), Bangladeshi (85.1%, a difference of 0.010%), and Immigrants from Japan (85.1%, a difference of 0.010%).
| Demographics | Rating | Rank | In Labor Force | Age 25-29 |
| Immigrants | Korea | 94.8 /100 | #94 | Exceptional 85.1% |
| Immigrants | Netherlands | 94.6 /100 | #95 | Exceptional 85.1% |
| Immigrants | Romania | 94.6 /100 | #96 | Exceptional 85.1% |
| Immigrants | Sudan | 94.3 /100 | #97 | Exceptional 85.1% |
| Mongolians | 94.1 /100 | #98 | Exceptional 85.1% |
| Bangladeshis | 94.0 /100 | #99 | Exceptional 85.1% |
| Immigrants | Switzerland | 93.9 /100 | #100 | Exceptional 85.1% |
| Egyptians | 93.8 /100 | #101 | Exceptional 85.1% |
| Slavs | 93.7 /100 | #102 | Exceptional 85.1% |
| Immigrants | Japan | 93.5 /100 | #103 | Exceptional 85.1% |
| Immigrants | Zaire | 93.3 /100 | #104 | Exceptional 85.1% |
| Immigrants | Hong Kong | 92.8 /100 | #105 | Exceptional 85.0% |
| Czechoslovakians | 92.6 /100 | #106 | Exceptional 85.0% |
| Immigrants | Southern Europe | 92.3 /100 | #107 | Exceptional 85.0% |
| Immigrants | Austria | 91.9 /100 | #108 | Exceptional 85.0% |