Immigrants from Grenada vs Ukrainian In Labor Force | Age 25-29
COMPARE
Immigrants from Grenada
Ukrainian
In Labor Force | Age 25-29
In Labor Force | Age 25-29 Comparison
Immigrants from Grenada
Ukrainians
82.8%
IN LABOR FORCE | AGE 25-29
0.0/ 100
METRIC RATING
303rd/ 347
METRIC RANK
85.2%
IN LABOR FORCE | AGE 25-29
96.7/ 100
METRIC RATING
86th/ 347
METRIC RANK
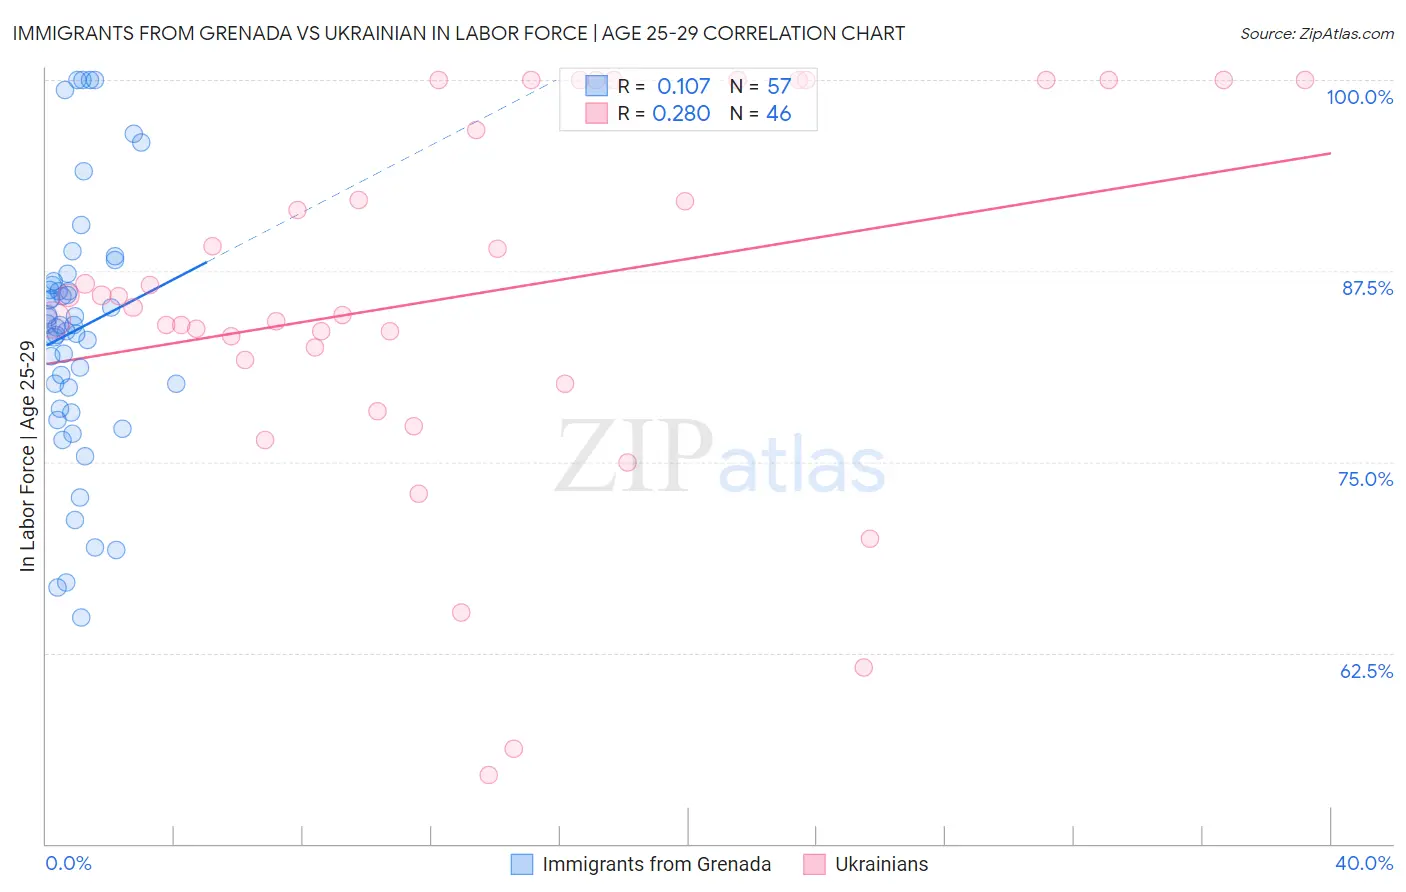
Immigrants from Grenada vs Ukrainian In Labor Force | Age 25-29 Correlation Chart
The statistical analysis conducted on geographies consisting of 67,199,109 people shows a poor positive correlation between the proportion of Immigrants from Grenada and labor force participation rate among population between the ages 25 and 29 in the United States with a correlation coefficient (R) of 0.107 and weighted average of 82.8%. Similarly, the statistical analysis conducted on geographies consisting of 448,388,747 people shows a weak positive correlation between the proportion of Ukrainians and labor force participation rate among population between the ages 25 and 29 in the United States with a correlation coefficient (R) of 0.280 and weighted average of 85.2%, a difference of 2.9%.
In Labor Force | Age 25-29 Correlation Summary
| Measurement | Immigrants from Grenada | Ukrainian |
| Minimum | 64.8% | 54.5% |
| Maximum | 100.0% | 100.0% |
| Range | 35.2% | 45.5% |
| Mean | 83.6% | 85.9% |
| Median | 84.0% | 85.5% |
| Interquartile 25% (IQ1) | 79.2% | 81.7% |
| Interquartile 75% (IQ3) | 86.7% | 100.0% |
| Interquartile Range (IQR) | 7.6% | 18.3% |
| Standard Deviation (Sample) | 8.3% | 11.9% |
| Standard Deviation (Population) | 8.3% | 11.8% |
Similar Demographics by In Labor Force | Age 25-29
Demographics Similar to Immigrants from Grenada by In Labor Force | Age 25-29
In terms of in labor force | age 25-29, the demographic groups most similar to Immigrants from Grenada are Immigrants from Belize (82.8%, a difference of 0.010%), Vietnamese (82.8%, a difference of 0.050%), Spanish American Indian (82.9%, a difference of 0.11%), Fijian (82.9%, a difference of 0.12%), and Immigrants from St. Vincent and the Grenadines (82.7%, a difference of 0.12%).
| Demographics | Rating | Rank | In Labor Force | Age 25-29 |
| Immigrants | Nicaragua | 0.0 /100 | #296 | Tragic 82.9% |
| Potawatomi | 0.0 /100 | #297 | Tragic 82.9% |
| Native Hawaiians | 0.0 /100 | #298 | Tragic 82.9% |
| Fijians | 0.0 /100 | #299 | Tragic 82.9% |
| Spanish American Indians | 0.0 /100 | #300 | Tragic 82.9% |
| Vietnamese | 0.0 /100 | #301 | Tragic 82.8% |
| Immigrants | Belize | 0.0 /100 | #302 | Tragic 82.8% |
| Immigrants | Grenada | 0.0 /100 | #303 | Tragic 82.8% |
| Immigrants | St. Vincent and the Grenadines | 0.0 /100 | #304 | Tragic 82.7% |
| Blacks/African Americans | 0.0 /100 | #305 | Tragic 82.6% |
| Blackfeet | 0.0 /100 | #306 | Tragic 82.6% |
| Cajuns | 0.0 /100 | #307 | Tragic 82.5% |
| Central American Indians | 0.0 /100 | #308 | Tragic 82.4% |
| Immigrants | Central America | 0.0 /100 | #309 | Tragic 82.4% |
| Osage | 0.0 /100 | #310 | Tragic 82.3% |
Demographics Similar to Ukrainians by In Labor Force | Age 25-29
In terms of in labor force | age 25-29, the demographic groups most similar to Ukrainians are Immigrants from Africa (85.2%, a difference of 0.0%), Immigrants from Europe (85.2%, a difference of 0.010%), Immigrants from Eastern Europe (85.2%, a difference of 0.010%), French Canadian (85.2%, a difference of 0.010%), and Immigrants from Croatia (85.2%, a difference of 0.010%).
| Demographics | Rating | Rank | In Labor Force | Age 25-29 |
| Immigrants | Northern Africa | 97.6 /100 | #79 | Exceptional 85.2% |
| Immigrants | Zimbabwe | 97.6 /100 | #80 | Exceptional 85.2% |
| Immigrants | Northern Europe | 97.2 /100 | #81 | Exceptional 85.2% |
| Okinawans | 97.0 /100 | #82 | Exceptional 85.2% |
| Immigrants | Europe | 96.8 /100 | #83 | Exceptional 85.2% |
| Immigrants | Eastern Europe | 96.8 /100 | #84 | Exceptional 85.2% |
| Immigrants | Africa | 96.7 /100 | #85 | Exceptional 85.2% |
| Ukrainians | 96.7 /100 | #86 | Exceptional 85.2% |
| French Canadians | 96.5 /100 | #87 | Exceptional 85.2% |
| Immigrants | Croatia | 96.4 /100 | #88 | Exceptional 85.2% |
| Immigrants | France | 96.3 /100 | #89 | Exceptional 85.2% |
| Burmese | 95.9 /100 | #90 | Exceptional 85.1% |
| Immigrants | Moldova | 95.8 /100 | #91 | Exceptional 85.1% |
| Immigrants | Costa Rica | 95.5 /100 | #92 | Exceptional 85.1% |
| Austrians | 95.3 /100 | #93 | Exceptional 85.1% |