Immigrants from Grenada vs Apache Unemployment Among Ages 25 to 29 years
COMPARE
Immigrants from Grenada
Apache
Unemployment Among Ages 25 to 29 years
Unemployment Among Ages 25 to 29 years Comparison
Immigrants from Grenada
Apache
8.4%
UNEMPLOYMENT AMONG AGES 25 TO 29 YEARS
0.0/ 100
METRIC RATING
316th/ 347
METRIC RANK
9.5%
UNEMPLOYMENT AMONG AGES 25 TO 29 YEARS
0.0/ 100
METRIC RATING
328th/ 347
METRIC RANK
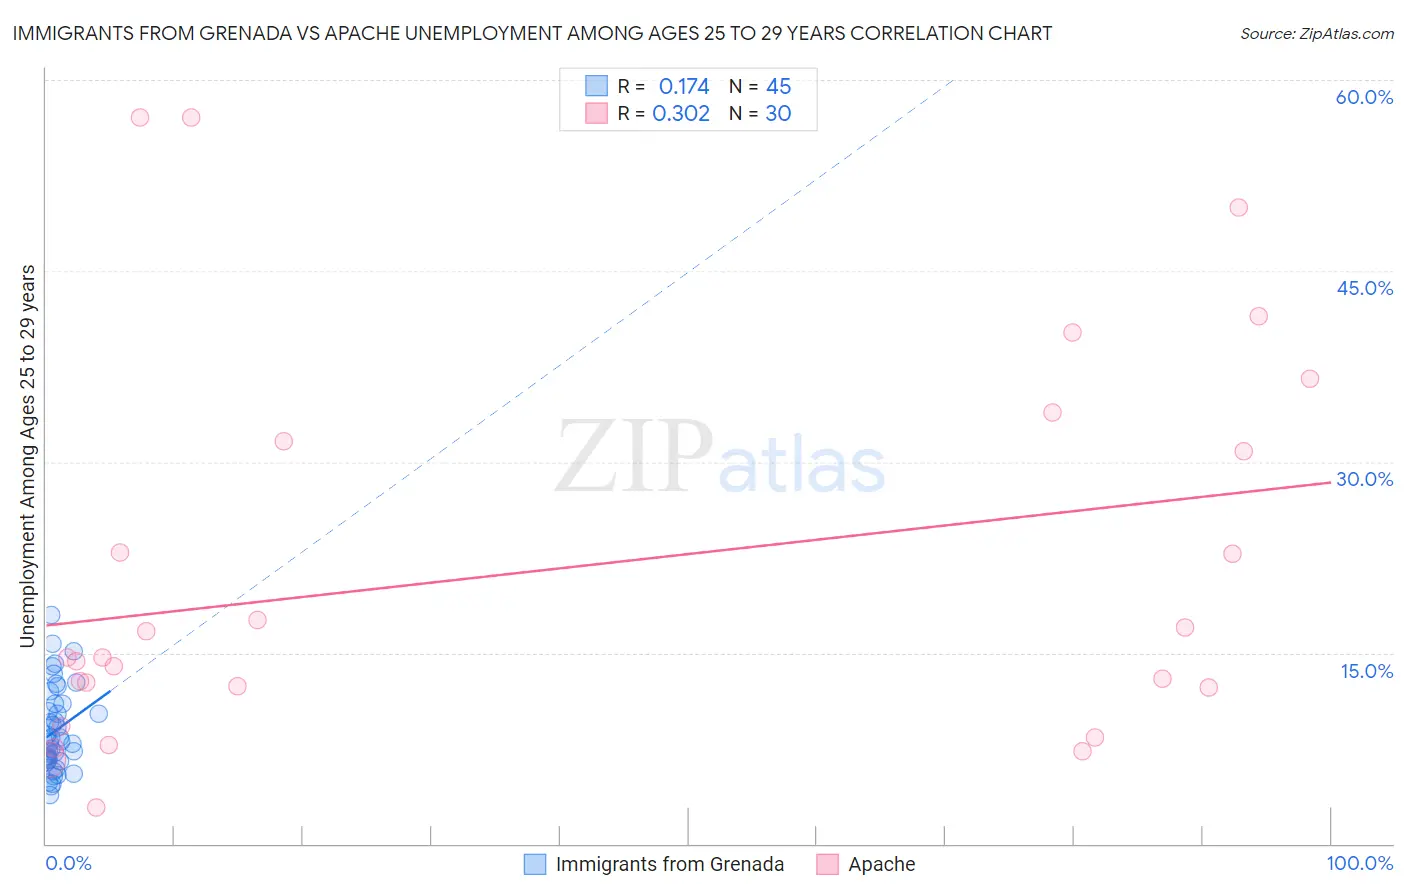
Immigrants from Grenada vs Apache Unemployment Among Ages 25 to 29 years Correlation Chart
The statistical analysis conducted on geographies consisting of 66,445,528 people shows a poor positive correlation between the proportion of Immigrants from Grenada and unemployment rate among population between the ages 25 and 29 in the United States with a correlation coefficient (R) of 0.174 and weighted average of 8.4%. Similarly, the statistical analysis conducted on geographies consisting of 224,498,621 people shows a mild positive correlation between the proportion of Apache and unemployment rate among population between the ages 25 and 29 in the United States with a correlation coefficient (R) of 0.302 and weighted average of 9.5%, a difference of 12.2%.
Unemployment Among Ages 25 to 29 years Correlation Summary
| Measurement | Immigrants from Grenada | Apache |
| Minimum | 3.8% | 2.8% |
| Maximum | 18.0% | 57.1% |
| Range | 14.2% | 54.3% |
| Mean | 8.9% | 21.5% |
| Median | 8.1% | 14.6% |
| Interquartile 25% (IQ1) | 6.6% | 12.3% |
| Interquartile 75% (IQ3) | 11.0% | 31.6% |
| Interquartile Range (IQR) | 4.4% | 19.3% |
| Standard Deviation (Sample) | 3.3% | 15.3% |
| Standard Deviation (Population) | 3.3% | 15.1% |
Demographics Similar to Immigrants from Grenada and Apache by Unemployment Among Ages 25 to 29 years
In terms of unemployment among ages 25 to 29 years, the demographic groups most similar to Immigrants from Grenada are British West Indian (8.4%, a difference of 0.070%), Immigrants from Guyana (8.5%, a difference of 0.090%), Guyanese (8.5%, a difference of 0.35%), Immigrants from Armenia (8.5%, a difference of 0.57%), and Immigrants from Dominica (8.4%, a difference of 0.66%). Similarly, the demographic groups most similar to Apache are Aleut (9.7%, a difference of 2.2%), Colville (9.2%, a difference of 2.6%), Shoshone (9.2%, a difference of 2.8%), Native/Alaskan (9.8%, a difference of 3.6%), and Alaska Native (10.2%, a difference of 7.5%).
| Demographics | Rating | Rank | Unemployment Among Ages 25 to 29 years |
| Dutch West Indians | 0.0 /100 | #312 | Tragic 8.2% |
| Immigrants | St. Vincent and the Grenadines | 0.0 /100 | #313 | Tragic 8.4% |
| Immigrants | Dominica | 0.0 /100 | #314 | Tragic 8.4% |
| British West Indians | 0.0 /100 | #315 | Tragic 8.4% |
| Immigrants | Grenada | 0.0 /100 | #316 | Tragic 8.4% |
| Immigrants | Guyana | 0.0 /100 | #317 | Tragic 8.5% |
| Guyanese | 0.0 /100 | #318 | Tragic 8.5% |
| Immigrants | Armenia | 0.0 /100 | #319 | Tragic 8.5% |
| Blacks/African Americans | 0.0 /100 | #320 | Tragic 8.6% |
| Immigrants | Dominican Republic | 0.0 /100 | #321 | Tragic 8.6% |
| Tlingit-Haida | 0.0 /100 | #322 | Tragic 8.7% |
| Dominicans | 0.0 /100 | #323 | Tragic 8.7% |
| Houma | 0.0 /100 | #324 | Tragic 8.7% |
| Yakama | 0.0 /100 | #325 | Tragic 8.8% |
| Shoshone | 0.0 /100 | #326 | Tragic 9.2% |
| Colville | 0.0 /100 | #327 | Tragic 9.2% |
| Apache | 0.0 /100 | #328 | Tragic 9.5% |
| Aleuts | 0.0 /100 | #329 | Tragic 9.7% |
| Natives/Alaskans | 0.0 /100 | #330 | Tragic 9.8% |
| Alaska Natives | 0.0 /100 | #331 | Tragic 10.2% |
| Pueblo | 0.0 /100 | #332 | Tragic 10.4% |