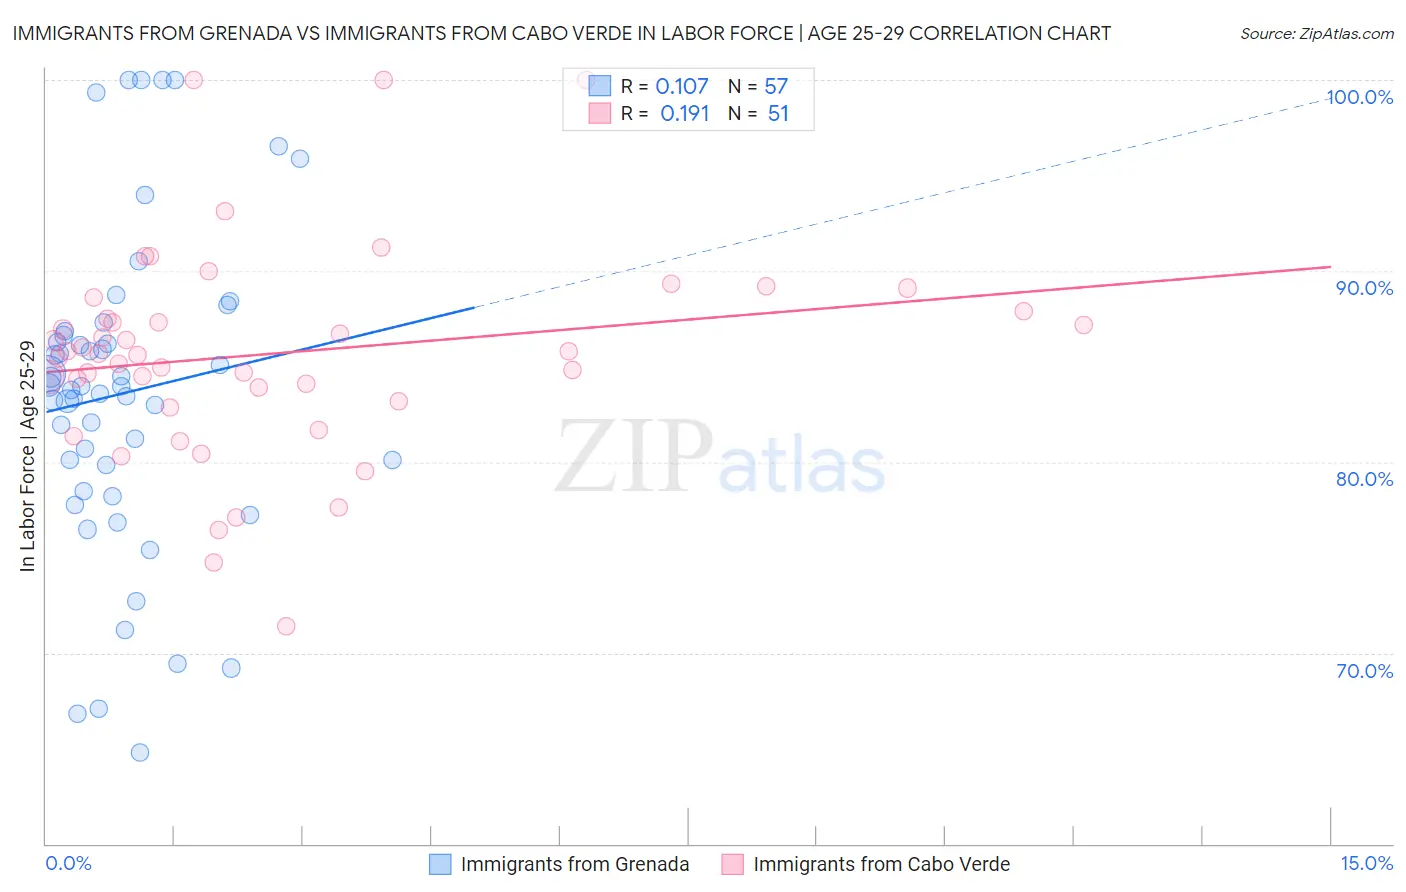
Immigrants from Grenada vs Immigrants from Cabo Verde In Labor Force | Age 25-29
COMPARE
Immigrants from Grenada
Immigrants from Cabo Verde
In Labor Force | Age 25-29
In Labor Force | Age 25-29 Comparison
Immigrants from Grenada
Immigrants from Cabo Verde
82.8%
IN LABOR FORCE | AGE 25-29
0.0/ 100
METRIC RATING
303rd/ 347
METRIC RANK
86.2%
IN LABOR FORCE | AGE 25-29
100.0/ 100
METRIC RATING
8th/ 347
METRIC RANK
Immigrants from Grenada vs Immigrants from Cabo Verde In Labor Force | Age 25-29 Correlation Chart
The statistical analysis conducted on geographies consisting of 67,199,109 people shows a poor positive correlation between the proportion of Immigrants from Grenada and labor force participation rate among population between the ages 25 and 29 in the United States with a correlation coefficient (R) of 0.107 and weighted average of 82.8%. Similarly, the statistical analysis conducted on geographies consisting of 38,156,394 people shows a poor positive correlation between the proportion of Immigrants from Cabo Verde and labor force participation rate among population between the ages 25 and 29 in the United States with a correlation coefficient (R) of 0.191 and weighted average of 86.2%, a difference of 4.1%.
In Labor Force | Age 25-29 Correlation Summary
| Measurement | Immigrants from Grenada | Immigrants from Cabo Verde |
| Minimum | 64.8% | 71.4% |
| Maximum | 100.0% | 100.0% |
| Range | 35.2% | 28.6% |
| Mean | 83.6% | 85.7% |
| Median | 84.0% | 85.7% |
| Interquartile 25% (IQ1) | 79.2% | 83.2% |
| Interquartile 75% (IQ3) | 86.7% | 87.9% |
| Interquartile Range (IQR) | 7.6% | 4.7% |
| Standard Deviation (Sample) | 8.3% | 5.6% |
| Standard Deviation (Population) | 8.3% | 5.5% |
Similar Demographics by In Labor Force | Age 25-29
Demographics Similar to Immigrants from Grenada by In Labor Force | Age 25-29
In terms of in labor force | age 25-29, the demographic groups most similar to Immigrants from Grenada are Immigrants from Belize (82.8%, a difference of 0.010%), Vietnamese (82.8%, a difference of 0.050%), Spanish American Indian (82.9%, a difference of 0.11%), Fijian (82.9%, a difference of 0.12%), and Immigrants from St. Vincent and the Grenadines (82.7%, a difference of 0.12%).
| Demographics | Rating | Rank | In Labor Force | Age 25-29 |
| Immigrants | Nicaragua | 0.0 /100 | #296 | Tragic 82.9% |
| Potawatomi | 0.0 /100 | #297 | Tragic 82.9% |
| Native Hawaiians | 0.0 /100 | #298 | Tragic 82.9% |
| Fijians | 0.0 /100 | #299 | Tragic 82.9% |
| Spanish American Indians | 0.0 /100 | #300 | Tragic 82.9% |
| Vietnamese | 0.0 /100 | #301 | Tragic 82.8% |
| Immigrants | Belize | 0.0 /100 | #302 | Tragic 82.8% |
| Immigrants | Grenada | 0.0 /100 | #303 | Tragic 82.8% |
| Immigrants | St. Vincent and the Grenadines | 0.0 /100 | #304 | Tragic 82.7% |
| Blacks/African Americans | 0.0 /100 | #305 | Tragic 82.6% |
| Blackfeet | 0.0 /100 | #306 | Tragic 82.6% |
| Cajuns | 0.0 /100 | #307 | Tragic 82.5% |
| Central American Indians | 0.0 /100 | #308 | Tragic 82.4% |
| Immigrants | Central America | 0.0 /100 | #309 | Tragic 82.4% |
| Osage | 0.0 /100 | #310 | Tragic 82.3% |
Demographics Similar to Immigrants from Cabo Verde by In Labor Force | Age 25-29
In terms of in labor force | age 25-29, the demographic groups most similar to Immigrants from Cabo Verde are Ethiopian (86.2%, a difference of 0.030%), Immigrants from Bosnia and Herzegovina (86.3%, a difference of 0.070%), Liberian (86.1%, a difference of 0.080%), Immigrants from Ethiopia (86.1%, a difference of 0.080%), and Immigrants from Lithuania (86.1%, a difference of 0.10%).
| Demographics | Rating | Rank | In Labor Force | Age 25-29 |
| Tsimshian | 100.0 /100 | #1 | Exceptional 88.7% |
| Immigrants | Somalia | 100.0 /100 | #2 | Exceptional 87.1% |
| Somalis | 100.0 /100 | #3 | Exceptional 87.1% |
| Carpatho Rusyns | 100.0 /100 | #4 | Exceptional 87.0% |
| Luxembourgers | 100.0 /100 | #5 | Exceptional 86.9% |
| Slovenes | 100.0 /100 | #6 | Exceptional 86.4% |
| Immigrants | Bosnia and Herzegovina | 100.0 /100 | #7 | Exceptional 86.3% |
| Immigrants | Cabo Verde | 100.0 /100 | #8 | Exceptional 86.2% |
| Ethiopians | 100.0 /100 | #9 | Exceptional 86.2% |
| Liberians | 100.0 /100 | #10 | Exceptional 86.1% |
| Immigrants | Ethiopia | 100.0 /100 | #11 | Exceptional 86.1% |
| Immigrants | Lithuania | 100.0 /100 | #12 | Exceptional 86.1% |
| Norwegians | 100.0 /100 | #13 | Exceptional 86.1% |
| Latvians | 100.0 /100 | #14 | Exceptional 86.1% |
| Bolivians | 100.0 /100 | #15 | Exceptional 86.1% |