Immigrants from Greece vs Armenian In Labor Force | Age > 16
COMPARE
Immigrants from Greece
Armenian
In Labor Force | Age > 16
In Labor Force | Age > 16 Comparison
Immigrants from Greece
Armenians
65.0%
IN LABOR FORCE | AGE > 16
34.3/ 100
METRIC RATING
189th/ 347
METRIC RANK
64.9%
IN LABOR FORCE | AGE > 16
20.2/ 100
METRIC RATING
200th/ 347
METRIC RANK
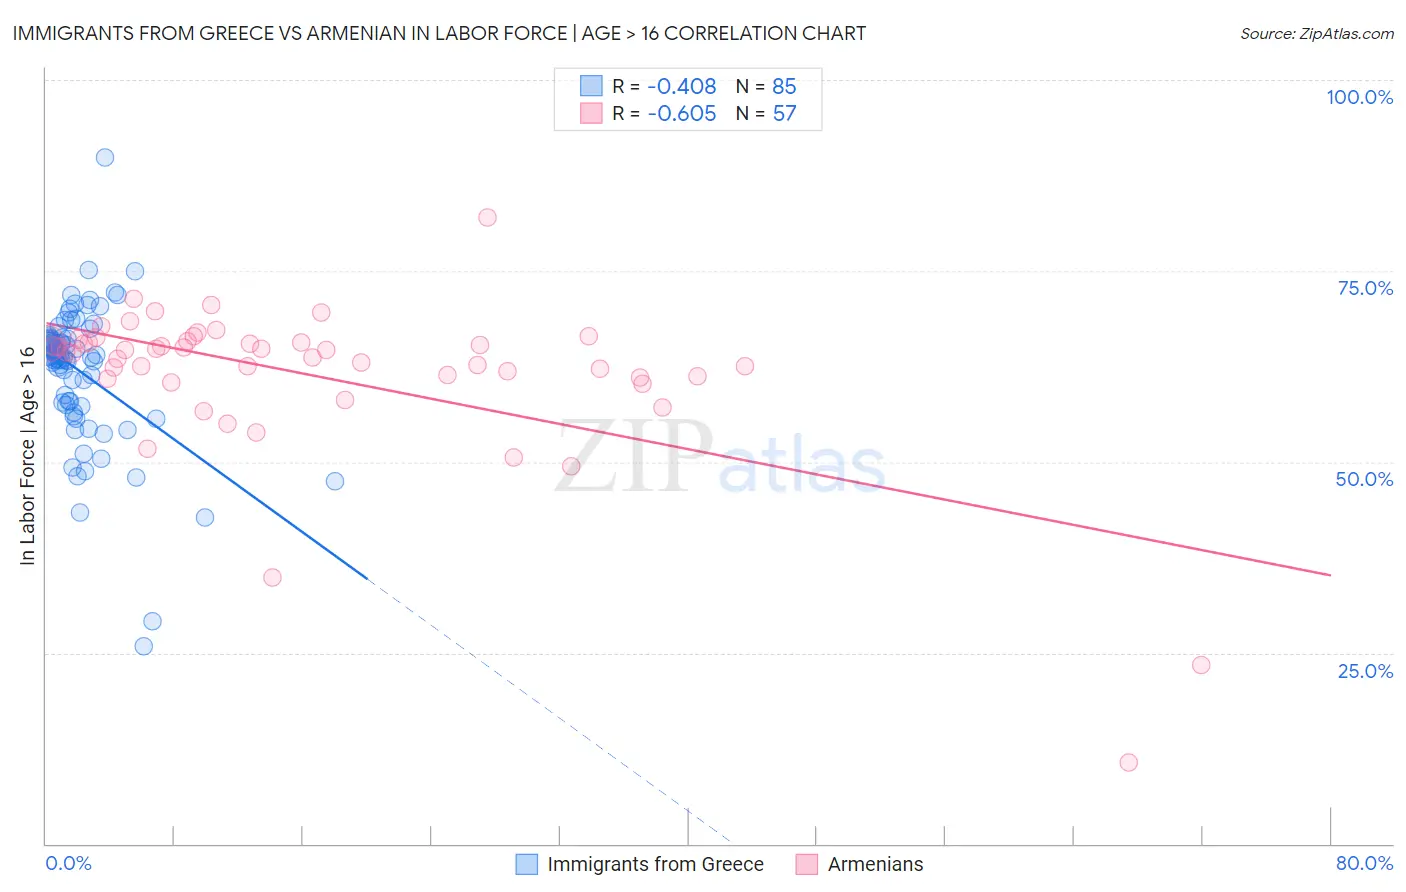
Immigrants from Greece vs Armenian In Labor Force | Age > 16 Correlation Chart
The statistical analysis conducted on geographies consisting of 216,877,956 people shows a moderate negative correlation between the proportion of Immigrants from Greece and labor force participation rate among population ages 16 and over in the United States with a correlation coefficient (R) of -0.408 and weighted average of 65.0%. Similarly, the statistical analysis conducted on geographies consisting of 310,962,108 people shows a significant negative correlation between the proportion of Armenians and labor force participation rate among population ages 16 and over in the United States with a correlation coefficient (R) of -0.605 and weighted average of 64.9%, a difference of 0.20%.
In Labor Force | Age > 16 Correlation Summary
| Measurement | Immigrants from Greece | Armenian |
| Minimum | 25.8% | 10.6% |
| Maximum | 89.9% | 82.0% |
| Range | 64.1% | 71.4% |
| Mean | 61.8% | 61.4% |
| Median | 63.8% | 64.4% |
| Interquartile 25% (IQ1) | 57.6% | 60.9% |
| Interquartile 75% (IQ3) | 66.2% | 65.7% |
| Interquartile Range (IQR) | 8.6% | 4.8% |
| Standard Deviation (Sample) | 9.2% | 10.8% |
| Standard Deviation (Population) | 9.2% | 10.7% |
Demographics Similar to Immigrants from Greece and Armenians by In Labor Force | Age > 16
In terms of in labor force | age > 16, the demographic groups most similar to Immigrants from Greece are Barbadian (65.0%, a difference of 0.0%), Immigrants from Portugal (65.0%, a difference of 0.010%), Scandinavian (65.0%, a difference of 0.010%), Immigrants from Fiji (65.0%, a difference of 0.010%), and Immigrants from Europe (65.0%, a difference of 0.010%). Similarly, the demographic groups most similar to Armenians are Ukrainian (64.9%, a difference of 0.010%), Immigrants from Belgium (64.9%, a difference of 0.020%), Russian (64.9%, a difference of 0.030%), Slovene (64.9%, a difference of 0.030%), and Mexican American Indian (64.9%, a difference of 0.050%).
| Demographics | Rating | Rank | In Labor Force | Age > 16 |
| Carpatho Rusyns | 40.0 /100 | #184 | Average 65.0% |
| Syrians | 40.0 /100 | #185 | Average 65.0% |
| Immigrants | Switzerland | 38.2 /100 | #186 | Fair 65.0% |
| Immigrants | Croatia | 35.7 /100 | #187 | Fair 65.0% |
| Immigrants | Portugal | 34.8 /100 | #188 | Fair 65.0% |
| Immigrants | Greece | 34.3 /100 | #189 | Fair 65.0% |
| Barbadians | 33.9 /100 | #190 | Fair 65.0% |
| Scandinavians | 33.7 /100 | #191 | Fair 65.0% |
| Immigrants | Fiji | 33.7 /100 | #192 | Fair 65.0% |
| Immigrants | Europe | 33.6 /100 | #193 | Fair 65.0% |
| Immigrants | Southern Europe | 31.3 /100 | #194 | Fair 65.0% |
| Romanians | 31.1 /100 | #195 | Fair 65.0% |
| Haitians | 30.6 /100 | #196 | Fair 65.0% |
| Immigrants | Italy | 28.7 /100 | #197 | Fair 65.0% |
| Greeks | 26.1 /100 | #198 | Fair 64.9% |
| Mexican American Indians | 23.1 /100 | #199 | Fair 64.9% |
| Armenians | 20.2 /100 | #200 | Fair 64.9% |
| Ukrainians | 19.6 /100 | #201 | Poor 64.9% |
| Immigrants | Belgium | 19.4 /100 | #202 | Poor 64.9% |
| Russians | 18.8 /100 | #203 | Poor 64.9% |
| Slovenes | 18.7 /100 | #204 | Poor 64.9% |