Immigrants from Ghana vs Panamanian High School Diploma
COMPARE
Immigrants from Ghana
Panamanian
High School Diploma
High School Diploma Comparison
Immigrants from Ghana
Panamanians
87.4%
HIGH SCHOOL DIPLOMA
0.5/ 100
METRIC RATING
258th/ 347
METRIC RANK
88.6%
HIGH SCHOOL DIPLOMA
18.0/ 100
METRIC RATING
202nd/ 347
METRIC RANK
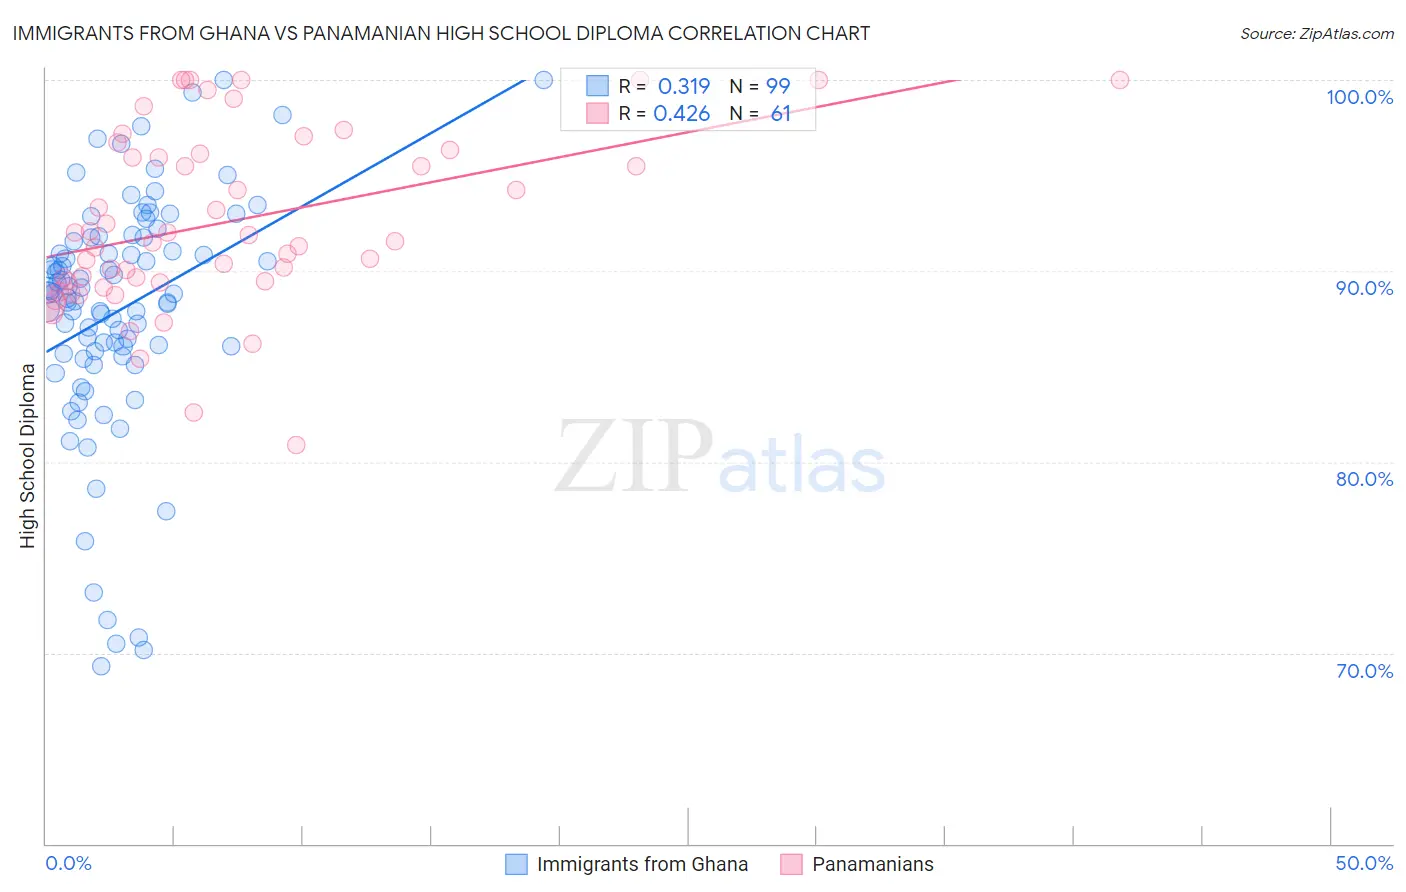
Immigrants from Ghana vs Panamanian High School Diploma Correlation Chart
The statistical analysis conducted on geographies consisting of 199,951,982 people shows a mild positive correlation between the proportion of Immigrants from Ghana and percentage of population with at least high school diploma education in the United States with a correlation coefficient (R) of 0.319 and weighted average of 87.4%. Similarly, the statistical analysis conducted on geographies consisting of 281,248,649 people shows a moderate positive correlation between the proportion of Panamanians and percentage of population with at least high school diploma education in the United States with a correlation coefficient (R) of 0.426 and weighted average of 88.6%, a difference of 1.5%.
High School Diploma Correlation Summary
| Measurement | Immigrants from Ghana | Panamanian |
| Minimum | 69.3% | 80.9% |
| Maximum | 100.0% | 100.0% |
| Range | 30.7% | 19.1% |
| Mean | 87.9% | 92.6% |
| Median | 88.9% | 91.5% |
| Interquartile 25% (IQ1) | 85.7% | 89.4% |
| Interquartile 75% (IQ3) | 91.8% | 96.2% |
| Interquartile Range (IQR) | 6.1% | 6.8% |
| Standard Deviation (Sample) | 6.3% | 4.6% |
| Standard Deviation (Population) | 6.3% | 4.6% |
Similar Demographics by High School Diploma
Demographics Similar to Immigrants from Ghana by High School Diploma
In terms of high school diploma, the demographic groups most similar to Immigrants from Ghana are Immigrants from Western Africa (87.4%, a difference of 0.010%), Cajun (87.3%, a difference of 0.080%), Bahamian (87.5%, a difference of 0.10%), Seminole (87.3%, a difference of 0.10%), and African (87.5%, a difference of 0.11%).
| Demographics | Rating | Rank | High School Diploma |
| Ghanaians | 1.4 /100 | #251 | Tragic 87.7% |
| Immigrants | South America | 1.2 /100 | #252 | Tragic 87.6% |
| Immigrants | Uruguay | 1.0 /100 | #253 | Tragic 87.6% |
| Immigrants | Colombia | 1.0 /100 | #254 | Tragic 87.6% |
| Immigrants | Senegal | 0.9 /100 | #255 | Tragic 87.6% |
| Africans | 0.7 /100 | #256 | Tragic 87.5% |
| Bahamians | 0.7 /100 | #257 | Tragic 87.5% |
| Immigrants | Ghana | 0.5 /100 | #258 | Tragic 87.4% |
| Immigrants | Western Africa | 0.5 /100 | #259 | Tragic 87.4% |
| Cajuns | 0.4 /100 | #260 | Tragic 87.3% |
| Seminole | 0.4 /100 | #261 | Tragic 87.3% |
| Immigrants | Peru | 0.4 /100 | #262 | Tragic 87.3% |
| Immigrants | South Eastern Asia | 0.3 /100 | #263 | Tragic 87.2% |
| Jamaicans | 0.3 /100 | #264 | Tragic 87.2% |
| U.S. Virgin Islanders | 0.2 /100 | #265 | Tragic 87.1% |
Demographics Similar to Panamanians by High School Diploma
In terms of high school diploma, the demographic groups most similar to Panamanians are Korean (88.6%, a difference of 0.0%), Hawaiian (88.6%, a difference of 0.010%), Somali (88.6%, a difference of 0.010%), Liberian (88.7%, a difference of 0.020%), and Marshallese (88.6%, a difference of 0.020%).
| Demographics | Rating | Rank | High School Diploma |
| Afghans | 23.9 /100 | #195 | Fair 88.8% |
| Immigrants | Southern Europe | 23.4 /100 | #196 | Fair 88.7% |
| French American Indians | 21.5 /100 | #197 | Fair 88.7% |
| Liberians | 18.8 /100 | #198 | Poor 88.7% |
| Marshallese | 18.7 /100 | #199 | Poor 88.6% |
| Hawaiians | 18.3 /100 | #200 | Poor 88.6% |
| Koreans | 18.1 /100 | #201 | Poor 88.6% |
| Panamanians | 18.0 /100 | #202 | Poor 88.6% |
| Somalis | 17.5 /100 | #203 | Poor 88.6% |
| Armenians | 17.2 /100 | #204 | Poor 88.6% |
| Immigrants | Micronesia | 16.4 /100 | #205 | Poor 88.6% |
| Arapaho | 16.1 /100 | #206 | Poor 88.6% |
| Immigrants | Sierra Leone | 15.8 /100 | #207 | Poor 88.6% |
| Portuguese | 14.4 /100 | #208 | Poor 88.5% |
| Cherokee | 14.3 /100 | #209 | Poor 88.5% |