Immigrants from Ghana vs Dutch West Indian In Labor Force | Age 25-29
COMPARE
Immigrants from Ghana
Dutch West Indian
In Labor Force | Age 25-29
In Labor Force | Age 25-29 Comparison
Immigrants from Ghana
Dutch West Indians
84.7%
IN LABOR FORCE | AGE 25-29
60.2/ 100
METRIC RATING
158th/ 347
METRIC RANK
81.1%
IN LABOR FORCE | AGE 25-29
0.0/ 100
METRIC RATING
325th/ 347
METRIC RANK
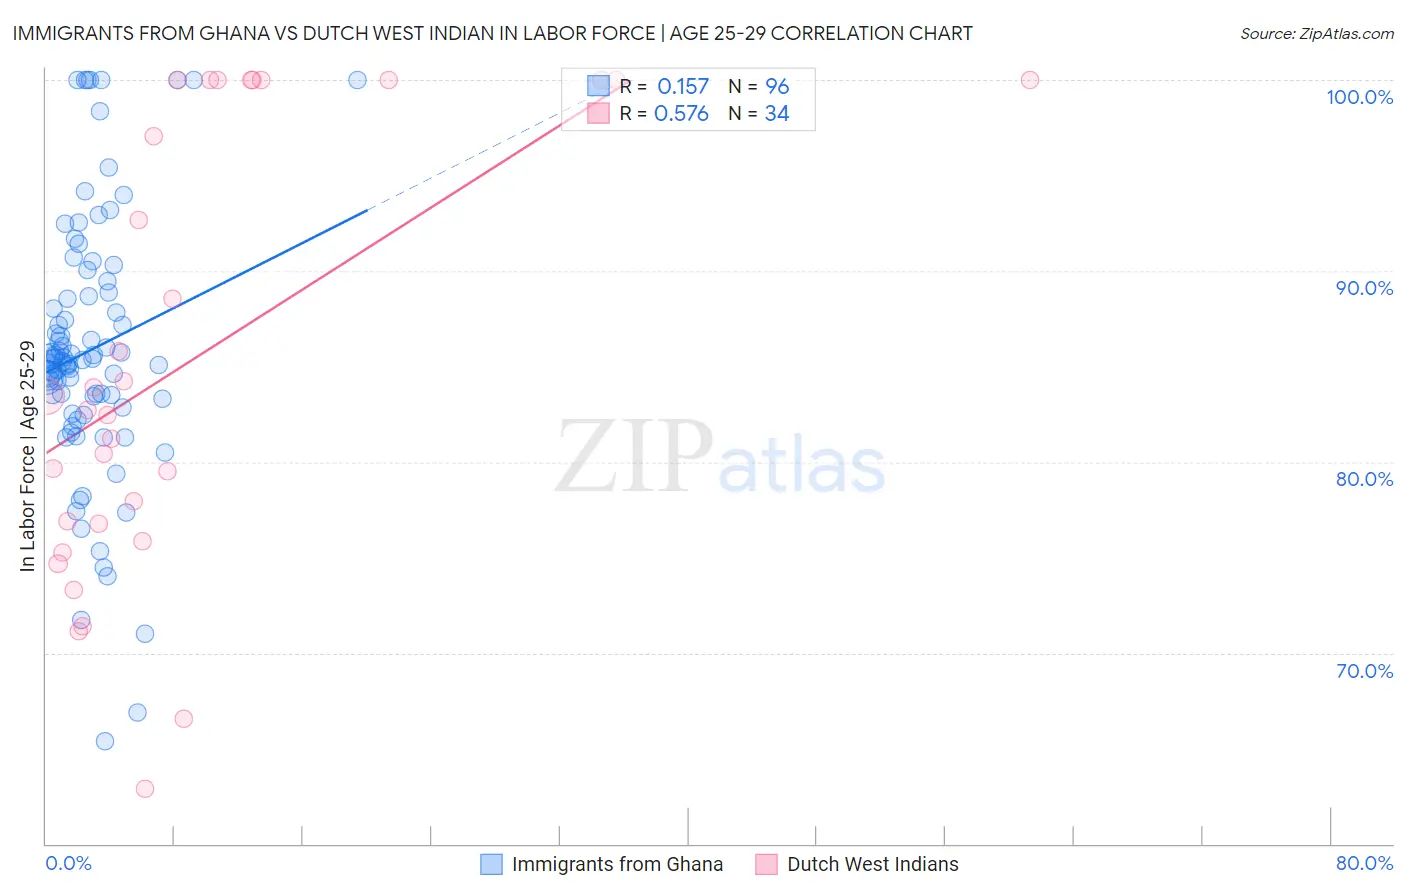
Immigrants from Ghana vs Dutch West Indian In Labor Force | Age 25-29 Correlation Chart
The statistical analysis conducted on geographies consisting of 199,929,683 people shows a poor positive correlation between the proportion of Immigrants from Ghana and labor force participation rate among population between the ages 25 and 29 in the United States with a correlation coefficient (R) of 0.157 and weighted average of 84.7%. Similarly, the statistical analysis conducted on geographies consisting of 85,749,797 people shows a substantial positive correlation between the proportion of Dutch West Indians and labor force participation rate among population between the ages 25 and 29 in the United States with a correlation coefficient (R) of 0.576 and weighted average of 81.1%, a difference of 4.4%.
In Labor Force | Age 25-29 Correlation Summary
| Measurement | Immigrants from Ghana | Dutch West Indian |
| Minimum | 65.4% | 62.9% |
| Maximum | 100.0% | 100.0% |
| Range | 34.6% | 37.1% |
| Mean | 85.9% | 85.4% |
| Median | 85.4% | 83.1% |
| Interquartile 25% (IQ1) | 83.1% | 76.8% |
| Interquartile 75% (IQ3) | 88.8% | 100.0% |
| Interquartile Range (IQR) | 5.7% | 23.2% |
| Standard Deviation (Sample) | 7.0% | 11.5% |
| Standard Deviation (Population) | 6.9% | 11.4% |
Similar Demographics by In Labor Force | Age 25-29
Demographics Similar to Immigrants from Ghana by In Labor Force | Age 25-29
In terms of in labor force | age 25-29, the demographic groups most similar to Immigrants from Ghana are British (84.7%, a difference of 0.0%), Immigrants from Western Africa (84.7%, a difference of 0.0%), Immigrants from Sri Lanka (84.7%, a difference of 0.010%), Indian (Asian) (84.7%, a difference of 0.010%), and French (84.7%, a difference of 0.010%).
| Demographics | Rating | Rank | In Labor Force | Age 25-29 |
| Colombians | 62.8 /100 | #151 | Good 84.7% |
| Immigrants | Pakistan | 62.7 /100 | #152 | Good 84.7% |
| Immigrants | Taiwan | 62.2 /100 | #153 | Good 84.7% |
| Immigrants | Sri Lanka | 61.7 /100 | #154 | Good 84.7% |
| Indians (Asian) | 61.6 /100 | #155 | Good 84.7% |
| French | 61.0 /100 | #156 | Good 84.7% |
| British | 60.4 /100 | #157 | Good 84.7% |
| Immigrants | Ghana | 60.2 /100 | #158 | Good 84.7% |
| Immigrants | Western Africa | 60.1 /100 | #159 | Good 84.7% |
| Immigrants | Peru | 58.6 /100 | #160 | Average 84.7% |
| Canadians | 58.5 /100 | #161 | Average 84.7% |
| Immigrants | Colombia | 58.3 /100 | #162 | Average 84.7% |
| Argentineans | 57.9 /100 | #163 | Average 84.7% |
| Ghanaians | 57.6 /100 | #164 | Average 84.7% |
| Immigrants | Burma/Myanmar | 57.4 /100 | #165 | Average 84.7% |
Demographics Similar to Dutch West Indians by In Labor Force | Age 25-29
In terms of in labor force | age 25-29, the demographic groups most similar to Dutch West Indians are Houma (81.2%, a difference of 0.11%), Choctaw (81.0%, a difference of 0.20%), Ute (80.8%, a difference of 0.41%), Alaska Native (81.6%, a difference of 0.52%), and Creek (80.7%, a difference of 0.55%).
| Demographics | Rating | Rank | In Labor Force | Age 25-29 |
| Comanche | 0.0 /100 | #318 | Tragic 81.9% |
| Seminole | 0.0 /100 | #319 | Tragic 81.7% |
| Colville | 0.0 /100 | #320 | Tragic 81.6% |
| Shoshone | 0.0 /100 | #321 | Tragic 81.6% |
| Kiowa | 0.0 /100 | #322 | Tragic 81.6% |
| Alaska Natives | 0.0 /100 | #323 | Tragic 81.6% |
| Houma | 0.0 /100 | #324 | Tragic 81.2% |
| Dutch West Indians | 0.0 /100 | #325 | Tragic 81.1% |
| Choctaw | 0.0 /100 | #326 | Tragic 81.0% |
| Ute | 0.0 /100 | #327 | Tragic 80.8% |
| Creek | 0.0 /100 | #328 | Tragic 80.7% |
| Yakama | 0.0 /100 | #329 | Tragic 80.6% |
| Puerto Ricans | 0.0 /100 | #330 | Tragic 80.4% |
| Cheyenne | 0.0 /100 | #331 | Tragic 80.3% |
| Inupiat | 0.0 /100 | #332 | Tragic 79.8% |