Immigrants from Ghana vs Immigrants from France In Labor Force | Age 25-29
COMPARE
Immigrants from Ghana
Immigrants from France
In Labor Force | Age 25-29
In Labor Force | Age 25-29 Comparison
Immigrants from Ghana
Immigrants from France
84.7%
IN LABOR FORCE | AGE 25-29
60.2/ 100
METRIC RATING
158th/ 347
METRIC RANK
85.2%
IN LABOR FORCE | AGE 25-29
96.3/ 100
METRIC RATING
89th/ 347
METRIC RANK
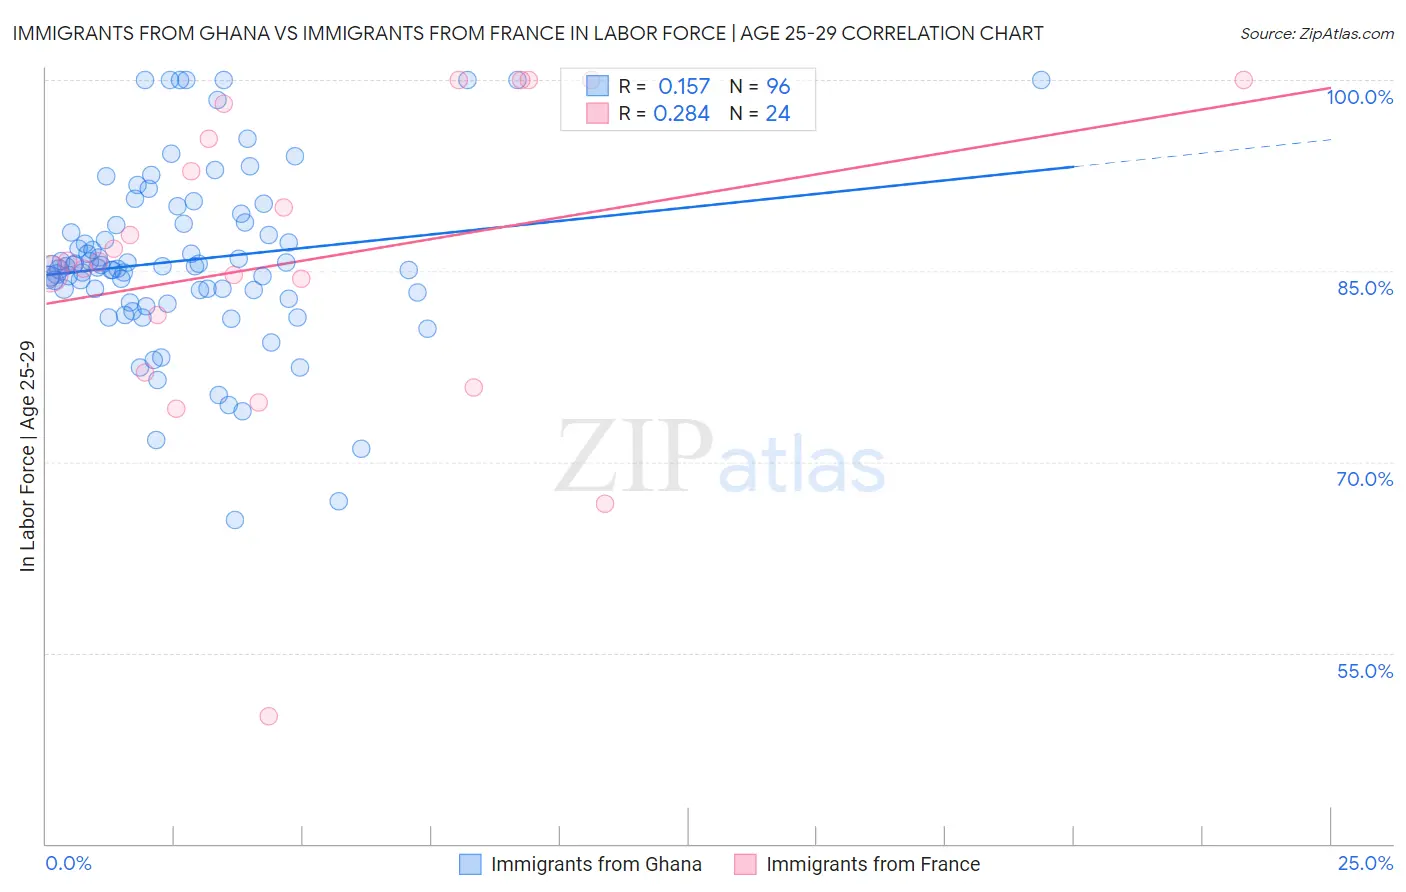
Immigrants from Ghana vs Immigrants from France In Labor Force | Age 25-29 Correlation Chart
The statistical analysis conducted on geographies consisting of 199,929,683 people shows a poor positive correlation between the proportion of Immigrants from Ghana and labor force participation rate among population between the ages 25 and 29 in the United States with a correlation coefficient (R) of 0.157 and weighted average of 84.7%. Similarly, the statistical analysis conducted on geographies consisting of 287,860,114 people shows a weak positive correlation between the proportion of Immigrants from France and labor force participation rate among population between the ages 25 and 29 in the United States with a correlation coefficient (R) of 0.284 and weighted average of 85.2%, a difference of 0.52%.
In Labor Force | Age 25-29 Correlation Summary
| Measurement | Immigrants from Ghana | Immigrants from France |
| Minimum | 65.4% | 50.0% |
| Maximum | 100.0% | 100.0% |
| Range | 34.6% | 50.0% |
| Mean | 85.9% | 85.9% |
| Median | 85.4% | 85.7% |
| Interquartile 25% (IQ1) | 83.1% | 79.3% |
| Interquartile 75% (IQ3) | 88.8% | 96.7% |
| Interquartile Range (IQR) | 5.7% | 17.4% |
| Standard Deviation (Sample) | 7.0% | 12.2% |
| Standard Deviation (Population) | 6.9% | 11.9% |
Similar Demographics by In Labor Force | Age 25-29
Demographics Similar to Immigrants from Ghana by In Labor Force | Age 25-29
In terms of in labor force | age 25-29, the demographic groups most similar to Immigrants from Ghana are British (84.7%, a difference of 0.0%), Immigrants from Western Africa (84.7%, a difference of 0.0%), Immigrants from Sri Lanka (84.7%, a difference of 0.010%), Indian (Asian) (84.7%, a difference of 0.010%), and French (84.7%, a difference of 0.010%).
| Demographics | Rating | Rank | In Labor Force | Age 25-29 |
| Colombians | 62.8 /100 | #151 | Good 84.7% |
| Immigrants | Pakistan | 62.7 /100 | #152 | Good 84.7% |
| Immigrants | Taiwan | 62.2 /100 | #153 | Good 84.7% |
| Immigrants | Sri Lanka | 61.7 /100 | #154 | Good 84.7% |
| Indians (Asian) | 61.6 /100 | #155 | Good 84.7% |
| French | 61.0 /100 | #156 | Good 84.7% |
| British | 60.4 /100 | #157 | Good 84.7% |
| Immigrants | Ghana | 60.2 /100 | #158 | Good 84.7% |
| Immigrants | Western Africa | 60.1 /100 | #159 | Good 84.7% |
| Immigrants | Peru | 58.6 /100 | #160 | Average 84.7% |
| Canadians | 58.5 /100 | #161 | Average 84.7% |
| Immigrants | Colombia | 58.3 /100 | #162 | Average 84.7% |
| Argentineans | 57.9 /100 | #163 | Average 84.7% |
| Ghanaians | 57.6 /100 | #164 | Average 84.7% |
| Immigrants | Burma/Myanmar | 57.4 /100 | #165 | Average 84.7% |
Demographics Similar to Immigrants from France by In Labor Force | Age 25-29
In terms of in labor force | age 25-29, the demographic groups most similar to Immigrants from France are French Canadian (85.2%, a difference of 0.010%), Immigrants from Croatia (85.2%, a difference of 0.010%), Immigrants from Eastern Europe (85.2%, a difference of 0.020%), Immigrants from Africa (85.2%, a difference of 0.020%), and Ukrainian (85.2%, a difference of 0.020%).
| Demographics | Rating | Rank | In Labor Force | Age 25-29 |
| Okinawans | 97.0 /100 | #82 | Exceptional 85.2% |
| Immigrants | Europe | 96.8 /100 | #83 | Exceptional 85.2% |
| Immigrants | Eastern Europe | 96.8 /100 | #84 | Exceptional 85.2% |
| Immigrants | Africa | 96.7 /100 | #85 | Exceptional 85.2% |
| Ukrainians | 96.7 /100 | #86 | Exceptional 85.2% |
| French Canadians | 96.5 /100 | #87 | Exceptional 85.2% |
| Immigrants | Croatia | 96.4 /100 | #88 | Exceptional 85.2% |
| Immigrants | France | 96.3 /100 | #89 | Exceptional 85.2% |
| Burmese | 95.9 /100 | #90 | Exceptional 85.1% |
| Immigrants | Moldova | 95.8 /100 | #91 | Exceptional 85.1% |
| Immigrants | Costa Rica | 95.5 /100 | #92 | Exceptional 85.1% |
| Austrians | 95.3 /100 | #93 | Exceptional 85.1% |
| Immigrants | Korea | 94.8 /100 | #94 | Exceptional 85.1% |
| Immigrants | Netherlands | 94.6 /100 | #95 | Exceptional 85.1% |
| Immigrants | Romania | 94.6 /100 | #96 | Exceptional 85.1% |