Immigrants from Ghana vs Immigrants from Ecuador In Labor Force | Age 35-44
COMPARE
Immigrants from Ghana
Immigrants from Ecuador
In Labor Force | Age 35-44
In Labor Force | Age 35-44 Comparison
Immigrants from Ghana
Immigrants from Ecuador
84.7%
IN LABOR FORCE | AGE 35-44
90.4/ 100
METRIC RATING
128th/ 347
METRIC RANK
84.1%
IN LABOR FORCE | AGE 35-44
15.2/ 100
METRIC RATING
211th/ 347
METRIC RANK
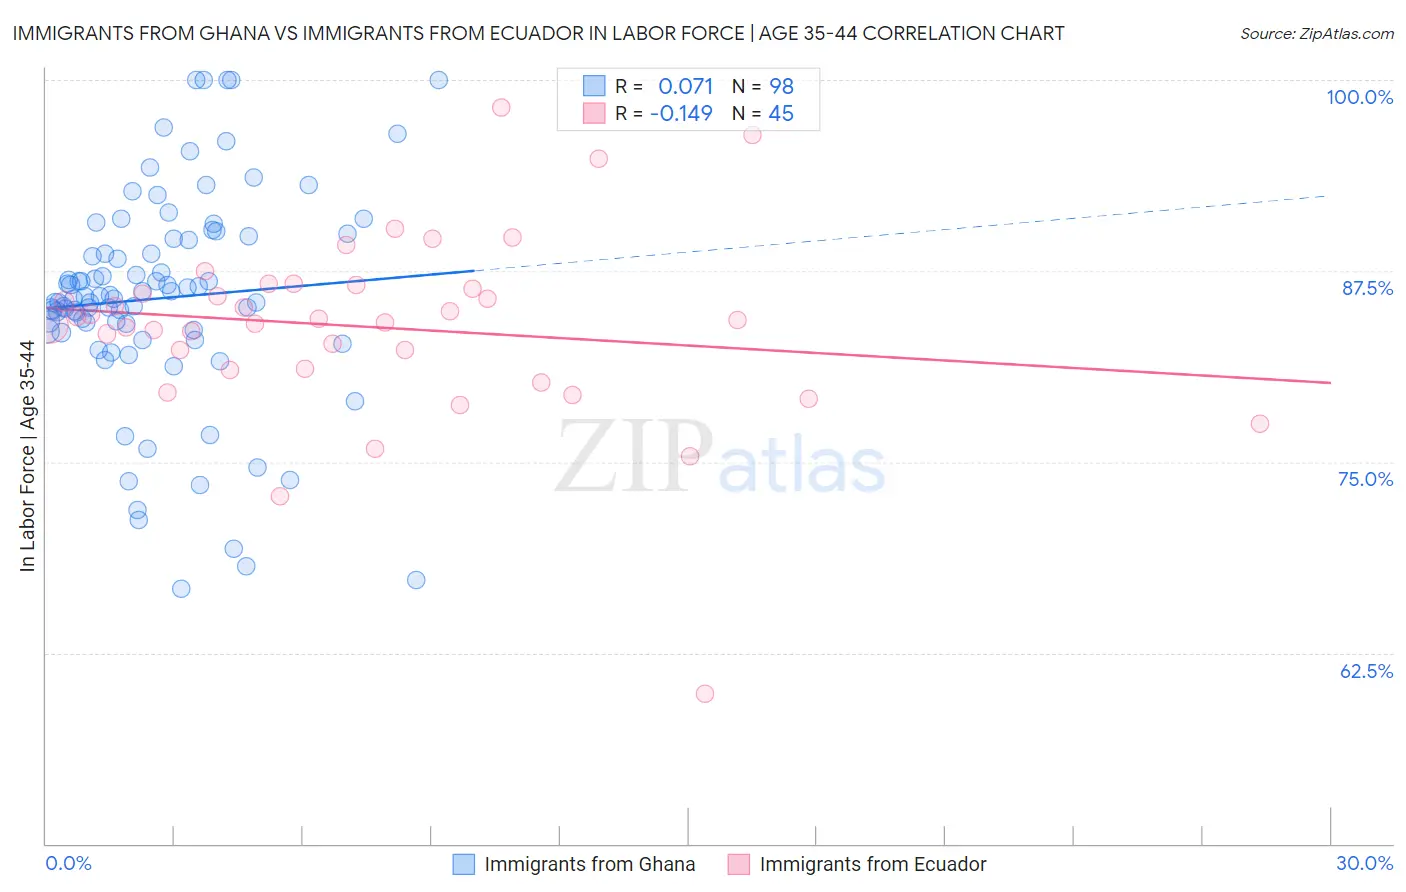
Immigrants from Ghana vs Immigrants from Ecuador In Labor Force | Age 35-44 Correlation Chart
The statistical analysis conducted on geographies consisting of 199,842,455 people shows a slight positive correlation between the proportion of Immigrants from Ghana and labor force participation rate among population between the ages 35 and 44 in the United States with a correlation coefficient (R) of 0.071 and weighted average of 84.7%. Similarly, the statistical analysis conducted on geographies consisting of 270,930,816 people shows a poor negative correlation between the proportion of Immigrants from Ecuador and labor force participation rate among population between the ages 35 and 44 in the United States with a correlation coefficient (R) of -0.149 and weighted average of 84.1%, a difference of 0.64%.
In Labor Force | Age 35-44 Correlation Summary
| Measurement | Immigrants from Ghana | Immigrants from Ecuador |
| Minimum | 66.7% | 59.8% |
| Maximum | 100.0% | 98.2% |
| Range | 33.3% | 38.4% |
| Mean | 85.7% | 83.8% |
| Median | 85.8% | 84.3% |
| Interquartile 25% (IQ1) | 83.6% | 81.1% |
| Interquartile 75% (IQ3) | 89.6% | 86.4% |
| Interquartile Range (IQR) | 6.0% | 5.4% |
| Standard Deviation (Sample) | 7.0% | 6.2% |
| Standard Deviation (Population) | 7.0% | 6.1% |
Similar Demographics by In Labor Force | Age 35-44
Demographics Similar to Immigrants from Ghana by In Labor Force | Age 35-44
In terms of in labor force | age 35-44, the demographic groups most similar to Immigrants from Ghana are Asian (84.7%, a difference of 0.0%), Immigrants from Spain (84.7%, a difference of 0.0%), German (84.7%, a difference of 0.010%), Immigrants from South America (84.7%, a difference of 0.010%), and Slavic (84.7%, a difference of 0.010%).
| Demographics | Rating | Rank | In Labor Force | Age 35-44 |
| Finns | 91.2 /100 | #121 | Exceptional 84.7% |
| Germans | 91.0 /100 | #122 | Exceptional 84.7% |
| Immigrants | South America | 90.9 /100 | #123 | Exceptional 84.7% |
| Slavs | 90.8 /100 | #124 | Exceptional 84.7% |
| Maltese | 90.8 /100 | #125 | Exceptional 84.7% |
| Asians | 90.6 /100 | #126 | Exceptional 84.7% |
| Immigrants | Spain | 90.6 /100 | #127 | Exceptional 84.7% |
| Immigrants | Ghana | 90.4 /100 | #128 | Exceptional 84.7% |
| Palestinians | 89.7 /100 | #129 | Excellent 84.7% |
| Bhutanese | 89.7 /100 | #130 | Excellent 84.7% |
| Immigrants | Scotland | 89.6 /100 | #131 | Excellent 84.7% |
| Austrians | 89.4 /100 | #132 | Excellent 84.7% |
| Argentineans | 88.4 /100 | #133 | Excellent 84.6% |
| Immigrants | Korea | 88.2 /100 | #134 | Excellent 84.6% |
| Immigrants | Malaysia | 87.5 /100 | #135 | Excellent 84.6% |
Demographics Similar to Immigrants from Ecuador by In Labor Force | Age 35-44
In terms of in labor force | age 35-44, the demographic groups most similar to Immigrants from Ecuador are New Zealander (84.1%, a difference of 0.010%), Israeli (84.1%, a difference of 0.010%), Bangladeshi (84.1%, a difference of 0.020%), Immigrants from North America (84.2%, a difference of 0.030%), and Swiss (84.2%, a difference of 0.030%).
| Demographics | Rating | Rank | In Labor Force | Age 35-44 |
| Canadians | 19.9 /100 | #204 | Poor 84.2% |
| Immigrants | Canada | 19.6 /100 | #205 | Poor 84.2% |
| Immigrants | Costa Rica | 19.5 /100 | #206 | Poor 84.2% |
| Laotians | 19.0 /100 | #207 | Poor 84.2% |
| Immigrants | North America | 18.1 /100 | #208 | Poor 84.2% |
| Swiss | 17.4 /100 | #209 | Poor 84.2% |
| New Zealanders | 16.2 /100 | #210 | Poor 84.1% |
| Immigrants | Ecuador | 15.2 /100 | #211 | Poor 84.1% |
| Israelis | 14.0 /100 | #212 | Poor 84.1% |
| Bangladeshis | 13.7 /100 | #213 | Poor 84.1% |
| Immigrants | Barbados | 13.2 /100 | #214 | Poor 84.1% |
| Europeans | 12.2 /100 | #215 | Poor 84.1% |
| Nicaraguans | 12.1 /100 | #216 | Poor 84.1% |
| Immigrants | Norway | 11.7 /100 | #217 | Poor 84.1% |
| Immigrants | Nicaragua | 9.4 /100 | #218 | Tragic 84.1% |