Immigrants from Germany vs Soviet Union In Labor Force | Age 20-24
COMPARE
Immigrants from Germany
Soviet Union
In Labor Force | Age 20-24
In Labor Force | Age 20-24 Comparison
Immigrants from Germany
Soviet Union
76.2%
IN LABOR FORCE | AGE 20-24
98.5/ 100
METRIC RATING
95th/ 347
METRIC RANK
72.3%
IN LABOR FORCE | AGE 20-24
0.0/ 100
METRIC RATING
308th/ 347
METRIC RANK
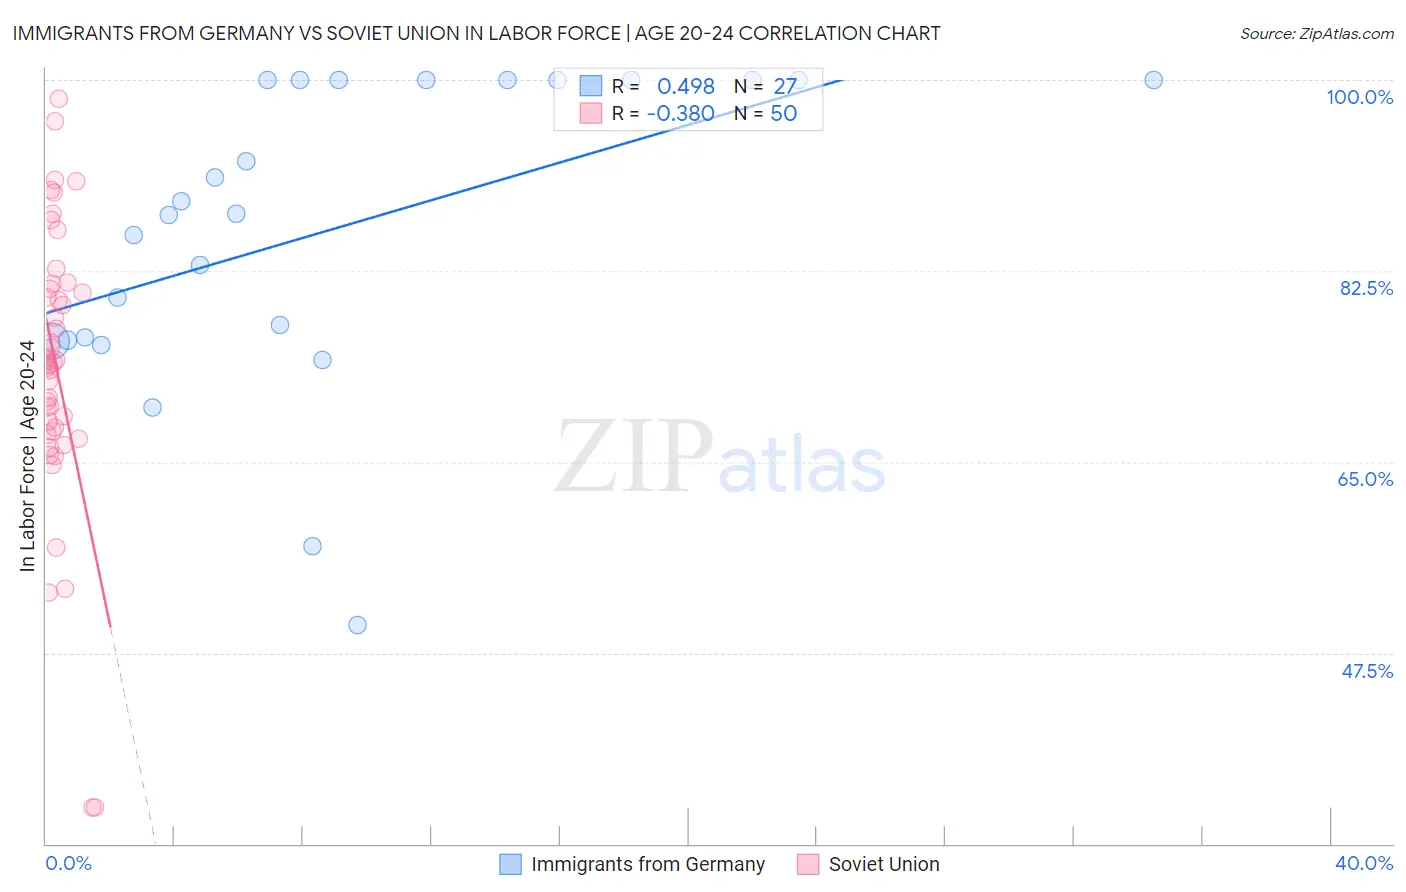
Immigrants from Germany vs Soviet Union In Labor Force | Age 20-24 Correlation Chart
The statistical analysis conducted on geographies consisting of 463,533,705 people shows a moderate positive correlation between the proportion of Immigrants from Germany and labor force participation rate among population between the ages 20 and 24 in the United States with a correlation coefficient (R) of 0.498 and weighted average of 76.2%. Similarly, the statistical analysis conducted on geographies consisting of 43,512,203 people shows a mild negative correlation between the proportion of Soviet Union and labor force participation rate among population between the ages 20 and 24 in the United States with a correlation coefficient (R) of -0.380 and weighted average of 72.3%, a difference of 5.5%.
In Labor Force | Age 20-24 Correlation Summary
| Measurement | Immigrants from Germany | Soviet Union |
| Minimum | 50.0% | 33.3% |
| Maximum | 100.0% | 98.3% |
| Range | 50.0% | 65.0% |
| Mean | 86.3% | 73.7% |
| Median | 87.8% | 74.1% |
| Interquartile 25% (IQ1) | 76.1% | 67.8% |
| Interquartile 75% (IQ3) | 100.0% | 80.9% |
| Interquartile Range (IQR) | 23.9% | 13.0% |
| Standard Deviation (Sample) | 14.0% | 12.9% |
| Standard Deviation (Population) | 13.7% | 12.7% |
Similar Demographics by In Labor Force | Age 20-24
Demographics Similar to Immigrants from Germany by In Labor Force | Age 20-24
In terms of in labor force | age 20-24, the demographic groups most similar to Immigrants from Germany are Potawatomi (76.2%, a difference of 0.0%), Nonimmigrants (76.2%, a difference of 0.010%), Hungarian (76.3%, a difference of 0.10%), Immigrants from Lithuania (76.1%, a difference of 0.11%), and Immigrants from Oceania (76.1%, a difference of 0.11%).
| Demographics | Rating | Rank | In Labor Force | Age 20-24 |
| Spanish | 99.2 /100 | #88 | Exceptional 76.4% |
| Bulgarians | 99.2 /100 | #89 | Exceptional 76.4% |
| Immigrants | Burma/Myanmar | 99.1 /100 | #90 | Exceptional 76.3% |
| Sierra Leoneans | 99.0 /100 | #91 | Exceptional 76.3% |
| Maltese | 98.9 /100 | #92 | Exceptional 76.3% |
| Hungarians | 98.9 /100 | #93 | Exceptional 76.3% |
| Potawatomi | 98.5 /100 | #94 | Exceptional 76.2% |
| Immigrants | Germany | 98.5 /100 | #95 | Exceptional 76.2% |
| Immigrants | Nonimmigrants | 98.5 /100 | #96 | Exceptional 76.2% |
| Immigrants | Lithuania | 98.0 /100 | #97 | Exceptional 76.1% |
| Immigrants | Oceania | 98.0 /100 | #98 | Exceptional 76.1% |
| Americans | 97.8 /100 | #99 | Exceptional 76.1% |
| Shoshone | 97.8 /100 | #100 | Exceptional 76.1% |
| Immigrants | Poland | 97.7 /100 | #101 | Exceptional 76.1% |
| Latvians | 97.6 /100 | #102 | Exceptional 76.1% |
Demographics Similar to Soviet Union by In Labor Force | Age 20-24
In terms of in labor force | age 20-24, the demographic groups most similar to Soviet Union are Tsimshian (72.3%, a difference of 0.0%), Immigrants from Ecuador (72.3%, a difference of 0.010%), Immigrants from Jamaica (72.4%, a difference of 0.16%), Immigrants from Singapore (72.4%, a difference of 0.18%), and Immigrants from West Indies (72.4%, a difference of 0.21%).
| Demographics | Rating | Rank | In Labor Force | Age 20-24 |
| Cubans | 0.0 /100 | #301 | Tragic 72.5% |
| Natives/Alaskans | 0.0 /100 | #302 | Tragic 72.4% |
| Ecuadorians | 0.0 /100 | #303 | Tragic 72.4% |
| Immigrants | West Indies | 0.0 /100 | #304 | Tragic 72.4% |
| Immigrants | Singapore | 0.0 /100 | #305 | Tragic 72.4% |
| Immigrants | Jamaica | 0.0 /100 | #306 | Tragic 72.4% |
| Immigrants | Ecuador | 0.0 /100 | #307 | Tragic 72.3% |
| Soviet Union | 0.0 /100 | #308 | Tragic 72.3% |
| Tsimshian | 0.0 /100 | #309 | Tragic 72.3% |
| Immigrants | Cuba | 0.0 /100 | #310 | Tragic 72.0% |
| Apache | 0.0 /100 | #311 | Tragic 72.0% |
| Immigrants | Caribbean | 0.0 /100 | #312 | Tragic 71.9% |
| Immigrants | Dominica | 0.0 /100 | #313 | Tragic 71.9% |
| Indians (Asian) | 0.0 /100 | #314 | Tragic 71.9% |
| Immigrants | Iran | 0.0 /100 | #315 | Tragic 71.8% |